


Exploring protein profiles and hub genes in ameloblastoma
- Authors:
- Published online on: February 20, 2024 https://doi.org/10.3892/br.2024.1752
- Article Number: 64
-
Copyright: © Sanguansin et al. This is an open access article distributed under the terms of Creative Commons Attribution License.
Abstract
Introduction
Ameloblastoma (AM) ranks among the most prevalent jaw tumors, originating in the odontogenic epithelium. It constitutes 9-11% of odontogenic tumors and 1% of all oral and maxillofacial tumors. Histologically benign, AM is slow growing but exhibits aggressive clinical behavior and a high recurrence propensity (1,2). The fifth edition of the World Health Organization Classification of Head and Neck Tumors (2022) categorizes AM as follows: Unicystic AM, conventional AM (hereafter, AM), extraosseous/peripheral AM and metastasizing AM. Additionally adenoid AM has been added in the group of benign epithelial odontogenic tumors as a new entity (2). Primarily found in the mandible (80%), AM typically occurs in individuals aged 30-40 years old (1,2). Standard treatment involves a wide surgical excision with a minimum 1 cm margin, but postsurgical challenges often lead to cosmetic and functional deformities (3). For the improvement of treatment options for AM, there is consideration for implementing precision medicine, which includes both gene and/or protein therapy. This approach aimed to tailor treatments based on the specific genetic and protein characteristics of individual patients, leading to more effective and personalized therapeutic interventions for AM. However, there was still a scarcity of molecular studies examining genetic and protein alterations in AM (3,4).
Cancer research encompassing genomics, transcriptomics and proteomics has yielded numerous breakthroughs, such as biomarker identification, molecular cancer classification and the ability to predict metastasis, treatment response and prognosis (5). Proteomics, examining the complete protein collection derived from a genome, including the isoforms, polymorphisms and post-translational modifications, leverages high-throughput techniques, such as mass spectrometry (MS) (6). Matrix-assisted laser desorption/ionization time-of-flight (MALDI-TOF) combines a MALDI source and TOF mass analyzer. Liquid chromatography with tandem MS (LC-MS/MS), an alternate tandem MS method, is commonly used to identify proteins. LC-MS/MS utilizes electrospray ionization, whereas MALDI-TOF employs MALDI as an ionization source, with each technique featuring variable operating and performance characteristics (7,8). To the best of the authors' knowledge, data regarding tumor protein expression patterns, particularly at the proteome level, remain limited, with a limited number of studies having explored proteins associated with AM tumorigenesis (9).
The present study aimed to identify AM protein profiles via LC-MS/MS, elucidate significant protein functions and determine hub genes. Histologically, AM is considered to originate from preameloblasts during the dental follicle (DF) period in the course of tooth development (3). Therefore, the AM protein profile was compared with that of the DF. In the present study, uniformity and homogeneity were demonstrated using a three-dimensional principal component analysis (PCA) scatterplot. Subsequently, novel proteins with differential levels in AM compared with DF were identified. Both upregulated and downregulated proteins were documented, and a protein interaction network was constructed. Ultimately, the insights gained from the hub genes contributed to an enhanced understanding of AM pathogenesis and may have clinical implications.
Materials and methods
Sample recruitment
A total of seven fresh-frozen AM tissues and five DF tissues were included in the present study. AM tissues were obtained during mandibulectomy from patients with AM (age range, 13-66 years; sex, female: male, 4:3), whereas DF tissues were obtained from patients who underwent wisdom tooth extraction (age range, 17-25 years; sex, female: male, 3:2). The Department of Oral and Maxillofacial Surgery, Faculty of Dentistry, Mahidol University, Bangkok, Thailand, served as the collection site from April 2021 to February 2022. The present study included AM samples with at least 80% tumor content, while cases with poor-quality DNA were excluded in the investigations. Specimens were halved, with one part undergoing histopathological confirmation. The demographic information for each sample is shown in Table SI. The present study was approved by the Institutional Review Board of the Faculty of Dentistry/Faculty of Pharmacology, Mahidol University, Bangkok, Thailand (approval no. COA.NO.MU-DT/PY-IRB 2021/034.3003) and was conducted in accordance with the Declaration of Helsinki (1975), as revised in 2013. Written informed consent was obtained from all patients.
Protein preparation for proteomics analysis
The frozen tissue, sized at 0.5x0.5x0.5 cm³, was collected at -80˚C and stored in a 1.5-ml tube. Subsequently, the tissue was ground in liquid nitrogen using an Axygen™ Tissue Grinder (Thermo Fisher Scientific, Inc.) and then solubilized using liquid nitrogen and detergent lysis [50 mM Tris-HCl (pH 7.2), 1% sodium dodecyl sulfate (SDS) and 20 mM dithiothreitol (DTT)], with mixing at room temperature for 10 min. Following sonication for 5 sec twice (80% amplitude), the lysed tissue was heated at 72˚C for 3 min before undergoing centrifugation at 12,000 x g for 30 min. Protein solutions were stored at -20˚C until analysis.
Gel-free digestion for proteomics analysis
Total protein pellets (3 g) were mixed with an MS analysis lysis buffer [0.1% RapidGest SF (Waters Corporation) in 20 mM ammonium bicarbonate]. Sulfhydryl bonds were reduced with 10 mM DTT in a 10-mM ammonium bicarbonate solution via heating at 60˚C for 1 h, followed by alkylation of sulfhydryl groups with 100 mM iodoacetamide in a 10-mM ammonium bicarbonate solution at room temperature for 45 min in a light-protected environment. After cleaning with Zeba Spin Desalting Columns (MilliporeSigma), digestion was performed by adding 50 ng/µl sequencing-grade trypsin (1:20; Promega Corporation) to the solution and incubating at 37˚C for 6 h. Tryptic peptides were dried at 44˚C under vacuum conditions, protonated with 0.1% formic acid and injected into the LC-MS/MS system (as described in the following section).
Label-free proteomic quantification via LC-MS/MS
Tryptic peptides were analyzed using an Ultimate 3000 Nano/Capillary LC System (Thermo Fisher Scientific, Inc.), coupled with a Hybrid Quadrupole Q-TOF Impact II™ (Bruker Daltonics; Bruker Corporation) equipped with a nano-captive spray ion source. Extracted peptides (500 ng) were added to the trapping column (PepMap100, C18, 300; Thermo Fisher Scientific, Inc.). At a column temperature of 60˚C, the sample was resolved on an analytical column (PepSwift C18 Nano Column, 100 m x15 cm). To elute peptides into the mass spectrometer, a linear gradient elution method with a gradual increase in mobile phases A and B at a steady flow rate of 0.35 l/min was used. Mobile phase A comprised water with 0.1% formic acid, whereas mobile phase B comprised 80% acetonitrile with 0.1% formic acid. The mobile phase gradients were conditioned as follows: i) Equilibration period, 0-4.0 min: 10% phase B; ii) separation period, 4.01-30.0 min: 10-60% phase B; iii) washing period, 30.01-40.00 min: 95% phase B; and iv) re-equilibration period, 40.01-50.00 min: 10% phase B. Electrospray ionization using CaptiveSpray was performed at 1.6 kV. MS and MS/MS spectra were fully collected in positive-ion mode (m/z=400-2,200), maintaining a mass accuracy within 1.6 parts per million (ppm) after tuning and internal calibration with sodium trifluoroacetate. LC-MS/MS spectra were collected using a data-dependent auto-MS/MS technique with a 3-sec cycle duration.
Proteomic data interpretation
Raw LC-MS/MS spectra were converted to mzXML format using CompassXport (v.3.0.9.2; Bruker Daltonics; Bruker Corporation). DeCyder MS 2.0 was employed to evaluate the mzXML format of LC-MS/MS datasets for label-free peptide quantification using the MS spectra profile (GE Healthcare). To determine the relative amount, peak volumes and charge states of the same peptide from different LC-MS runs using PepMatch modules version 0.7.8 (https://pypi.org/project/pepmatch/0.7.8/). Data processing followed specific criteria: Allowing three missed cleavages, setting a 20-ppm peptide mass tolerance for the primary search, using trypsin as the digesting enzyme, applying carbamidomethylation to cysteine as a fixed modification and considering oxidation of methionine and acetylation of the protein N-terminus as variable modifications. The selected protein was identified using Mascot (v. 2.3.02; Matrix Science, Ltd.).
Differentially expressed proteins (DEPs)
Information regarding particular proteins was annotated using UniProtKB/Swiss-Prot entries (http://www.uniprot.org). Enrichr software (https://amp.pharm.mssm.edu/Enrichr/) was used to conduct gene list enrichment analysis (10). DEPs in AM or DF tissue were identified and analyzed. Proteins specific to AM were termed ‘upregulated proteins’, whereas those exclusive to DF were labeled ‘downregulated proteins’.
Gene Ontology (GO) and pathway enrichment analyses
Freely accessible databases, namely the Database for Annotation, Visualization, and Integrated Discovery (DAVID; http://david.ncifcrf.gov/home.jsp) and the Kyoto Encyclopedia of Genes and Genomes (KEGG), provided biological data and analysis tools (https://www.genome.jp/kegg/pathway.html). DAVID was used for GO (11) and KEGG pathway enrichment analyses of differentially expressed genes (DEGs). Biological process (BP), cellular component (CC) and molecular function (MF) GO terms, as well as significant pathways associated with DEGs, were identified. A threshold of P<0.05 was used to determine statistical significance.
Protein-protein interaction (PPI) network construction and hub gene identification
NetworkAnalyst (https://www.networkanalyst.ca/), a free web-based tool for visualizing statistical meta-analysis, data mining and construction of biological networks, facilitated gene list meta-analysis (12). Biological data integration was achieved using robust statistical procedures and the data were visualized using PPI networks. In the present study, the Search Tool for Retrieval of Interacting Genes/Proteins (STRING) software version 11 (https://string-db.org/cgi/input.pl) was selected as a PPI database (13), requiring experimental evidence and a high confidence (900) cut-off score for reliable results. The number of proteins interacting with a node determined node importance. The top 10% of nodes by degree value were selected for potential physiological regulatory functions.
Statistical analysis
Individual samples were performed by LC-MS/MS in triplicate. The maximum score was applied to the protein score of each sample. Principal component analysis (PCA) was executed with the software ClinProTools 2.2. (Bruker Deltonik GmbH). Regarding DEPs, the number of unique proteins identified in each AM or DF group was recorded. An unpaired t-test was applied to identify DEPs and Fisher's exact test was used to assess for enrichment in GO terms and KEGG pathways. False discovery rate adjusted (P<0.05) was considered to indicate a statistically significant GO and KEGG pathway (11).
Results
Protein profile and analyses of DEPs
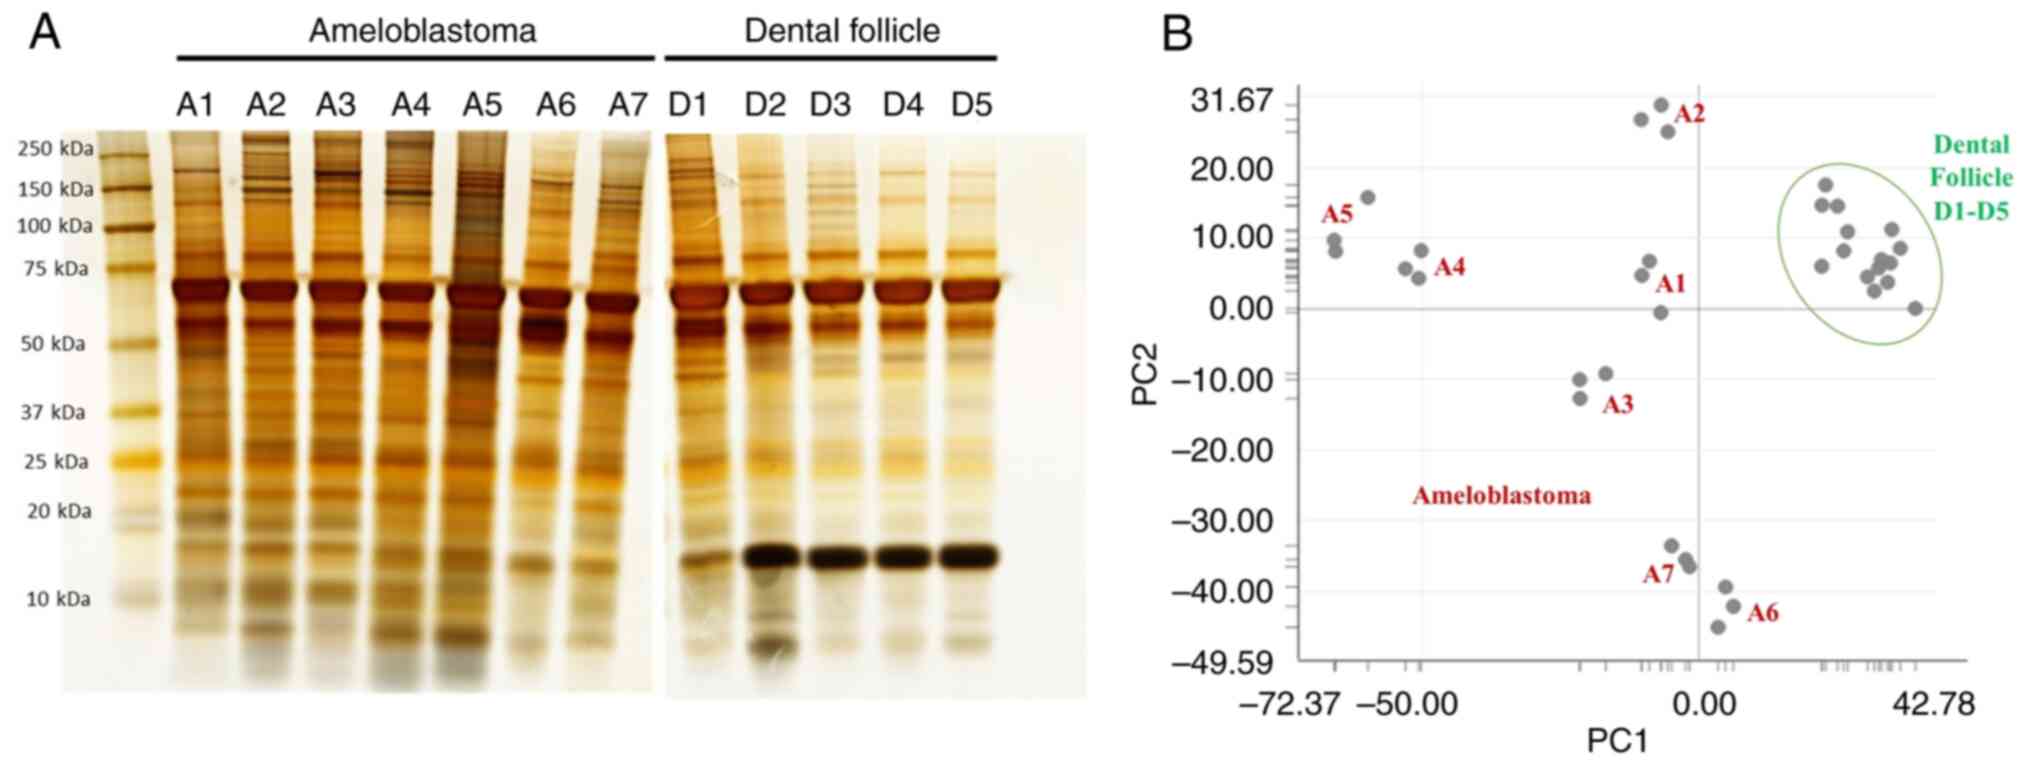
The AM (A1-A7) and DF (D1-D5) groups were isolated and further divided into two fractions. The first fraction was subjected to gel-based fractionation (4-20% gradient Bis-Tris SDS-polyacrylamide gel electrophoresis) to observe and compare protein profiles and the other fraction was subjected to LC-MS/MS to quantify DEPs. Gel-based protein extraction revealed distinct patterns between AM and DF protein profiles. Although both exhibited a similar 25-75 kDa range, the DF group displayed higher density in the 10-20 kDa range compared with the AM group (Fig. 1A). PCA reduced the data dimensionality to facilitate visualization and interpretation (Fig. 1B). Notably, the protein patterns differed between the AM and DF groups across various protein sizes, suggesting that these proteins play crucial roles in biological mechanisms with regard to function in tumor development, leading to substantial changes in protein abundance.
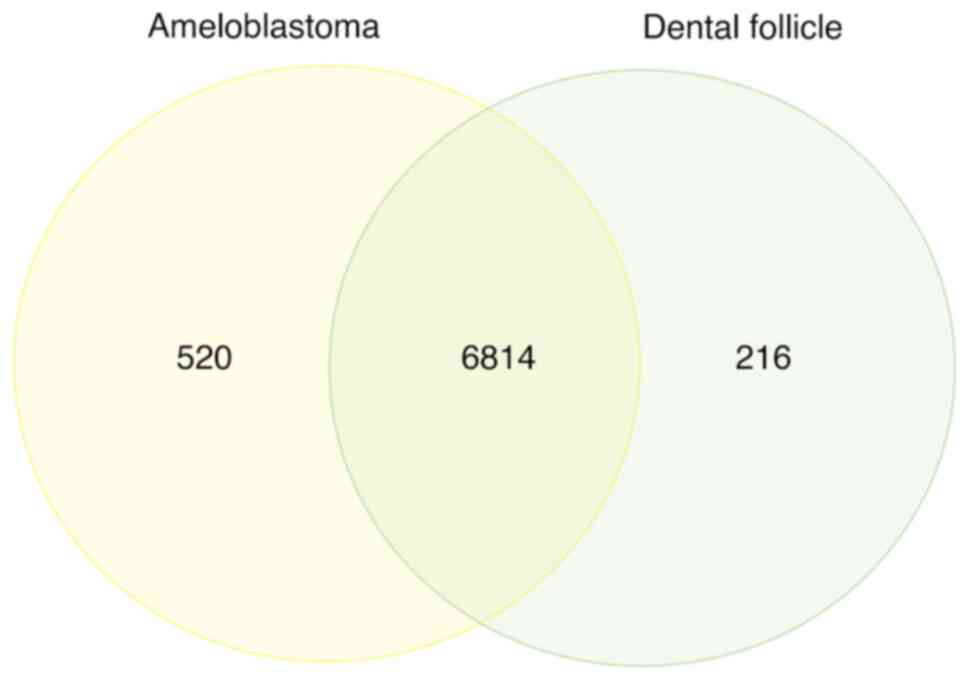
In addition to gel-based fractionation, gel-free proteomics is a highly sensitive method for protein identification and quantification. LC-MS/MS spectra from the LC runs were predominantly identified using the UniProt database, revealing 7,550 DEPs. According to the Venn diagram, the accounted proteins were those that were specific to each group, including 520 for AM and 216 for DF (Fig. 2). The uppermost 30 genes that were the most distinctive are presented in Table I. In AM, uncharacterized protein C7orf45 (CG045), 5-hydroxytryptamine receptor 5B, pseudogene (HTR5B), protein FAM47A (FA47A), Zinc finger protein 408 (ZN408) and protein Shroom4 (SHRM4) achieved the greatest scores. Conversely, in DF, ER degradation-enhancing alpha-mannosidase-like protein 2 (EDEM2), Arf-GAP with dual PH domain-containing protein 1 (ADAP1), angiopoietin-related protein 2 (ANGL2), histone-lysine N-methyltransferase SETD5 (SETD5) and Rho guanine nucleotide exchange factor 40 (ARH40) exhibited the highest scores.
GO term and KEGG pathway enrichment analyses of DEGs
To comprehend the biological functions of the identified DEGs, GO term and KEGG pathway enrichment analyses using DAVID were conducted. The top ten distinctive findings pertaining to BP, CC and MF specific to AM are highlighted in Table II. Notably, the most enriched genes were associated with ‘histone H2A monoubiquitination’ (BP), ‘actin filament-based movement’ (BP), ‘voltage-gated potassium channel complex’ (CC) and ‘ATP-binding’ (MF). The downregulated GO terms in AM, primarily involving ‘pro-B cell differentiation’ (BP), ‘cytoplasm’ (CC), ‘ATP-binding’ (MF) and ‘poly(A) RNA binding’ are presented in Table III.
Enrichment analysis of KEGG pathways unveiled an overrepresentation of specific pathways related to upregulated genes. ‘Platelet activation’ emerged as the most significant pathway, followed by the ‘Rap1 signaling pathway’, the ‘estrogen signaling pathway’, the ‘Fanconi anemia pathway’ and ‘oocyte meiosis’ (Table II). Conversely, downregulated genes were mainly involved in ‘proteoglycans in cancer’ and ‘the glucagon signaling pathway’, as indicated in Table III.
PPI network construction and hub gene identification
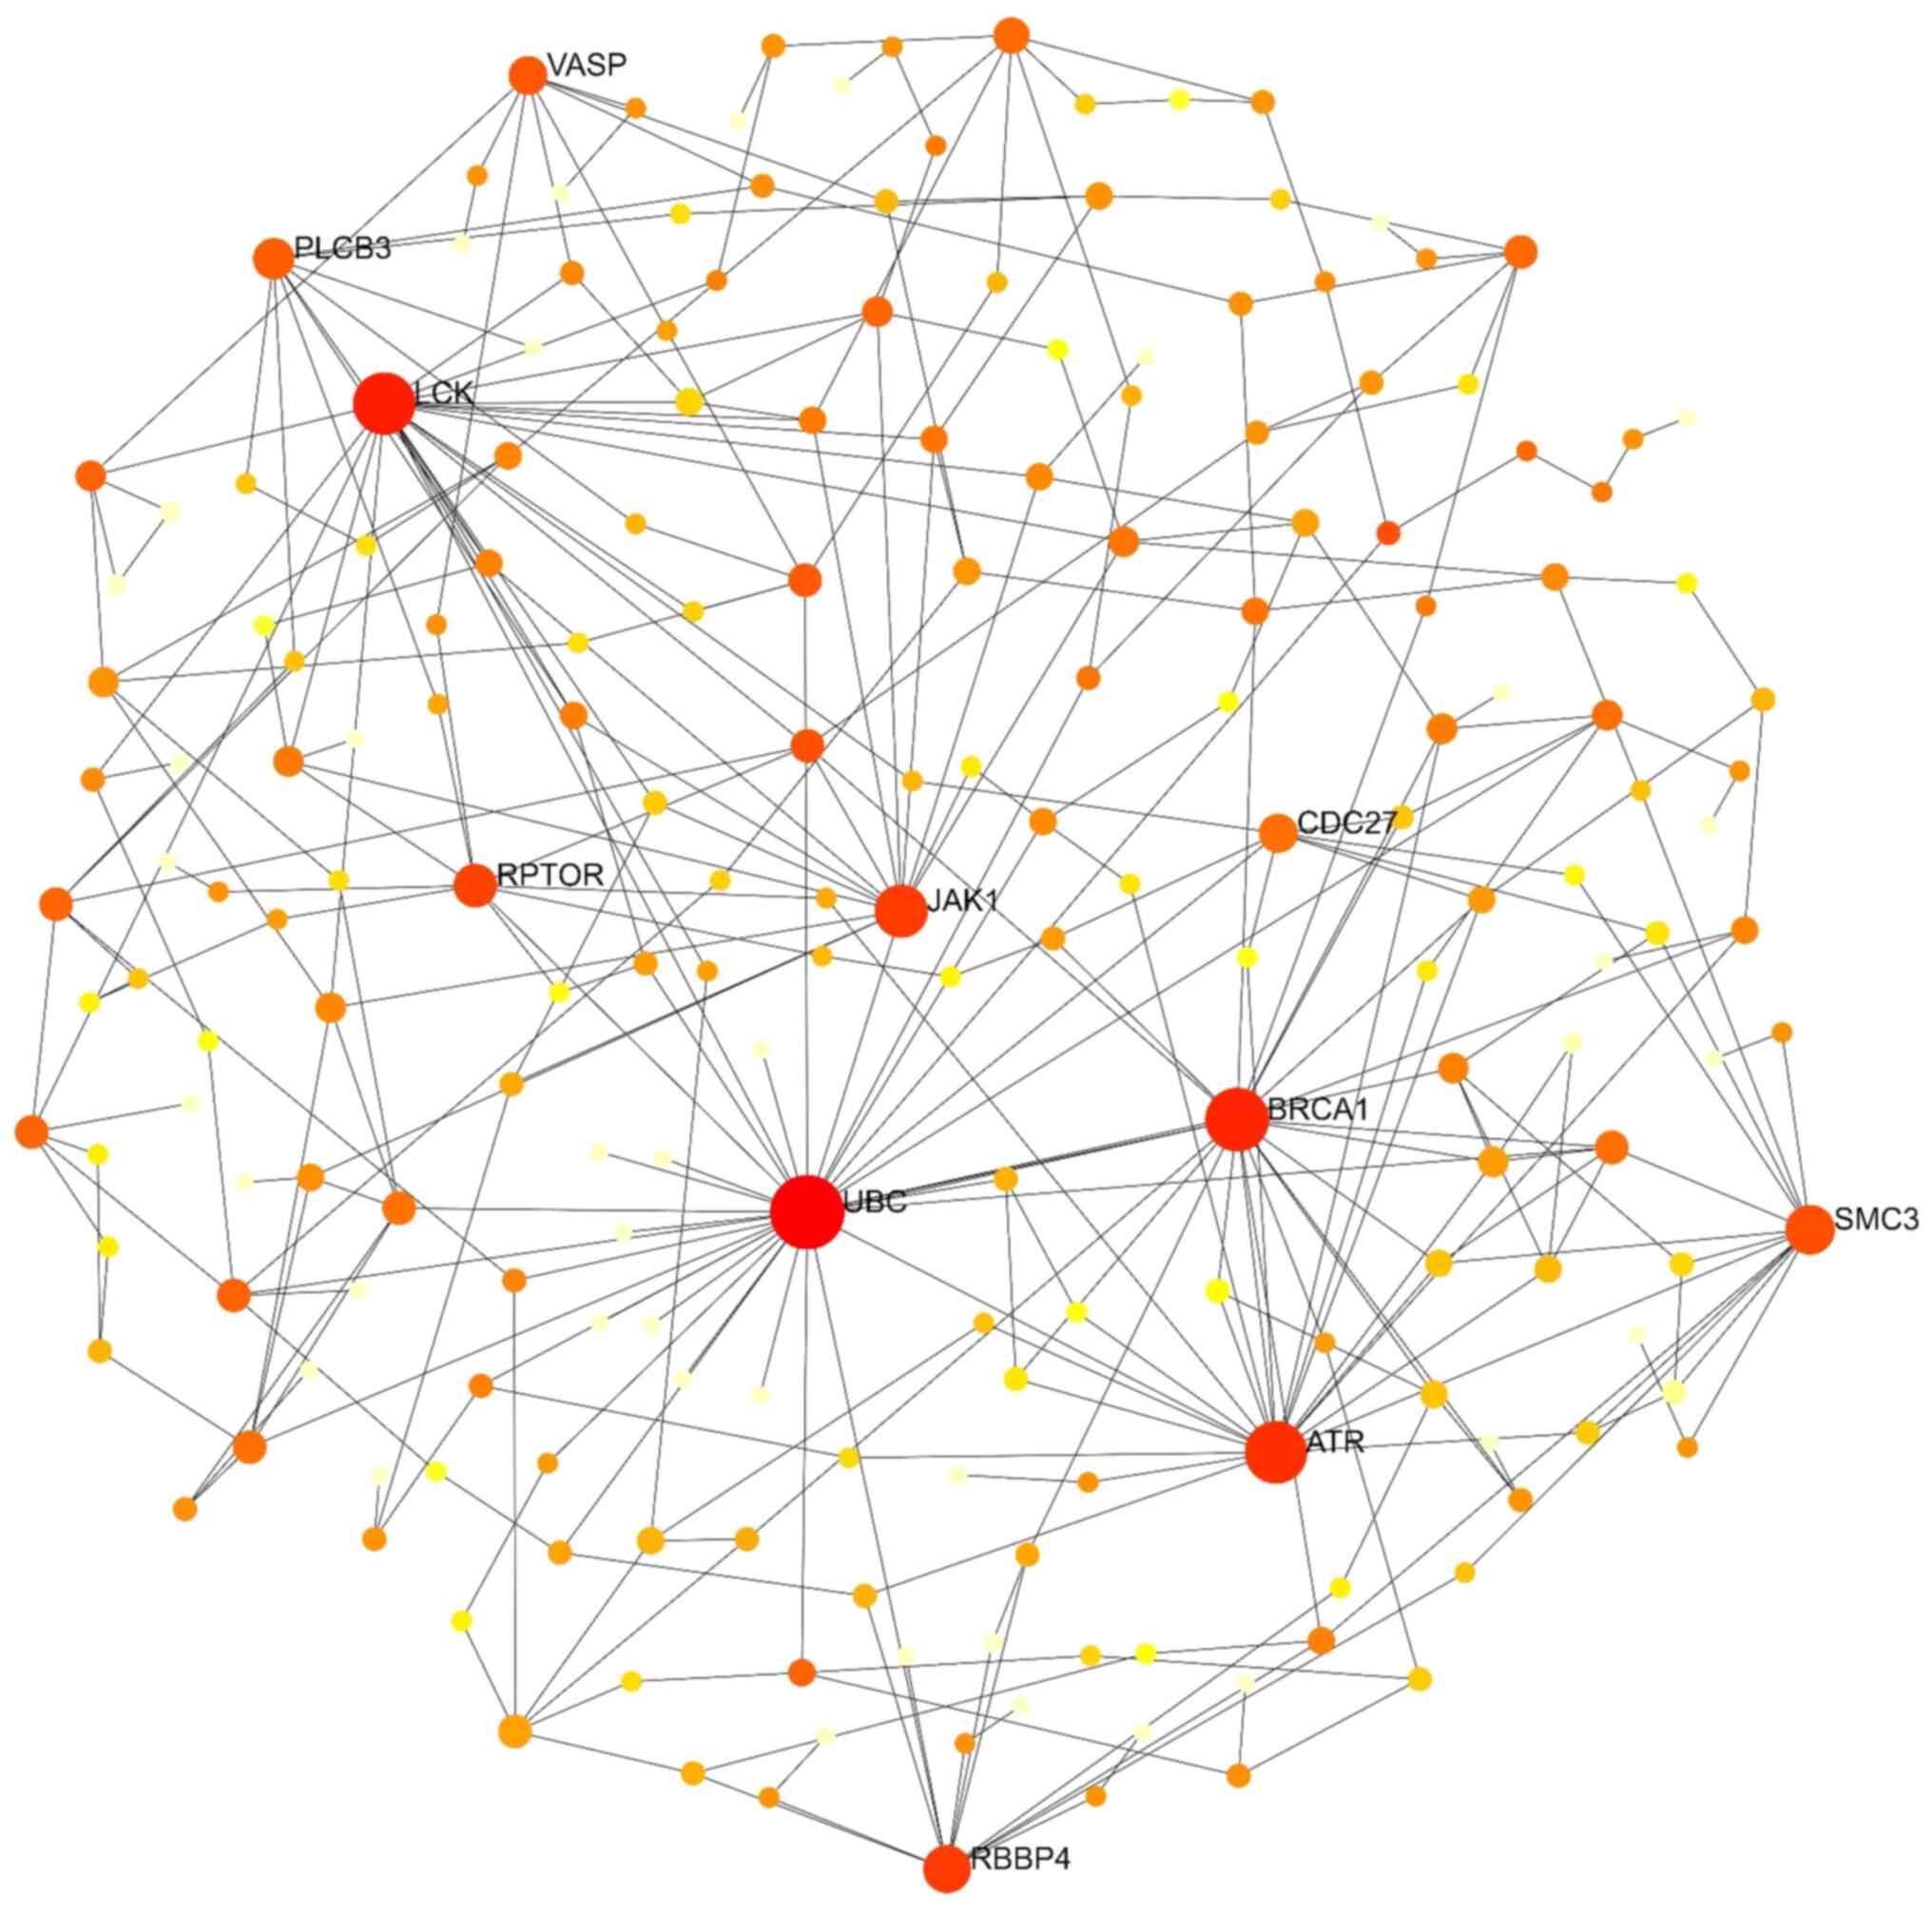
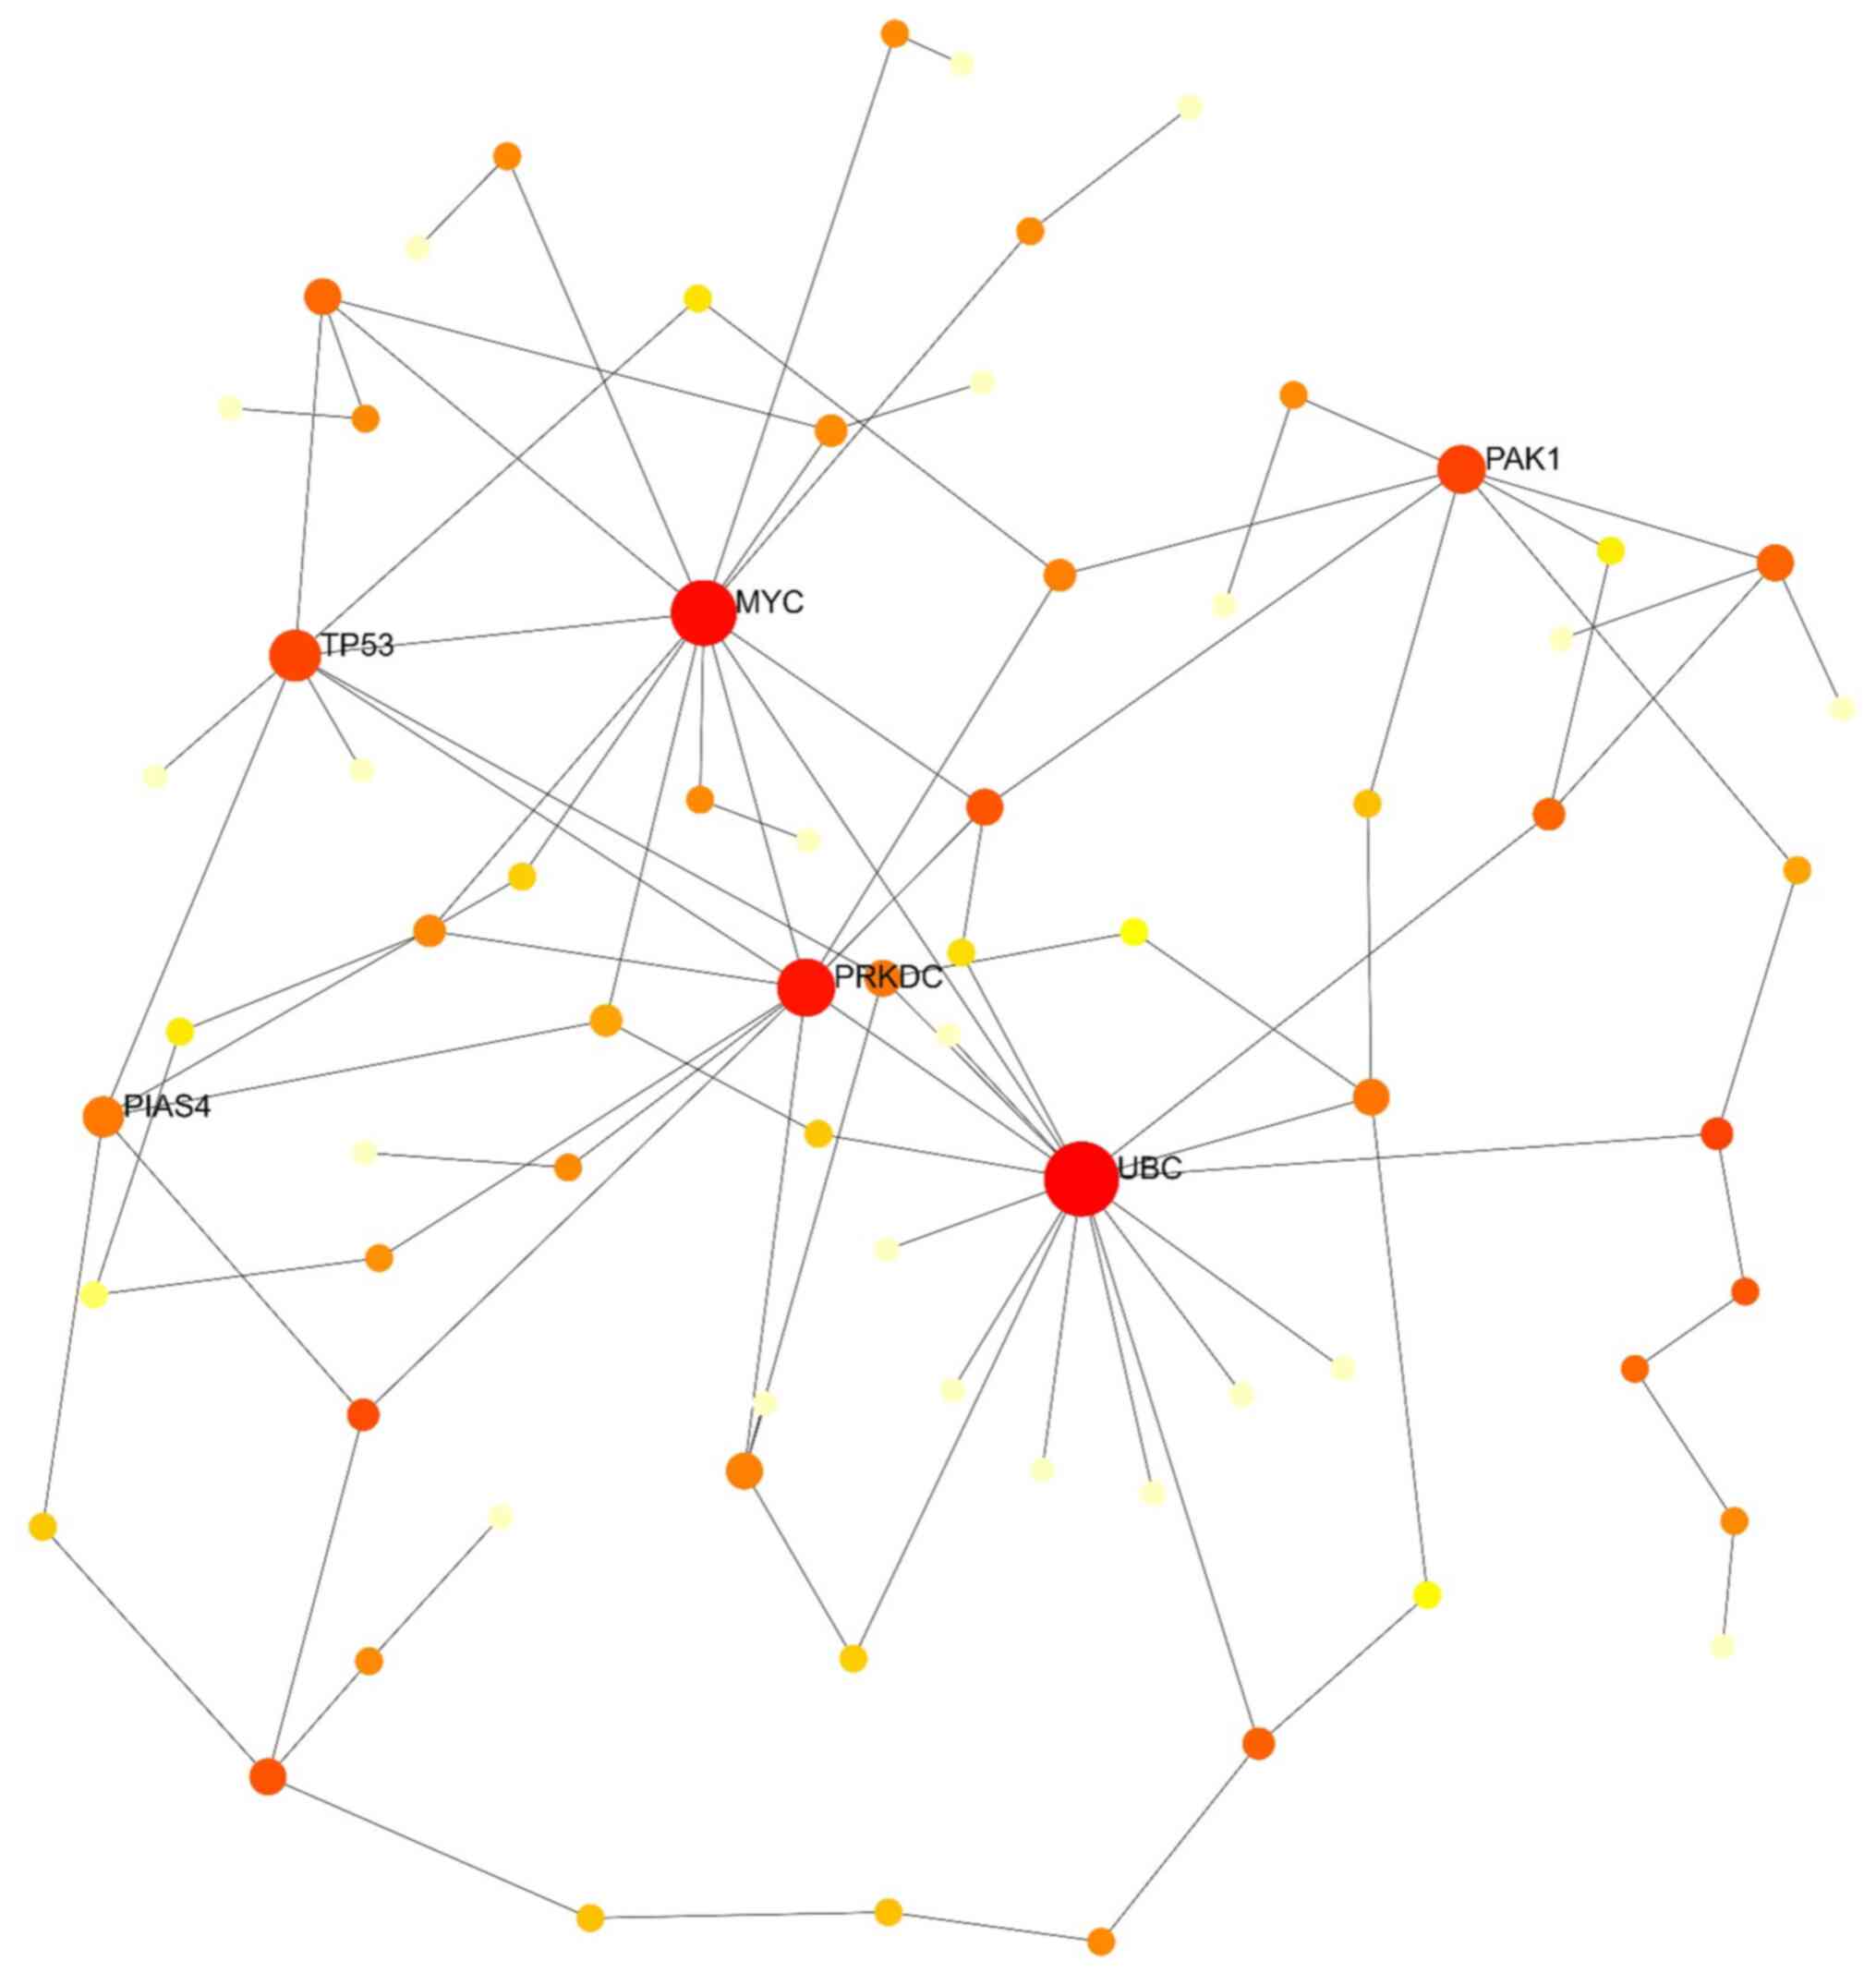
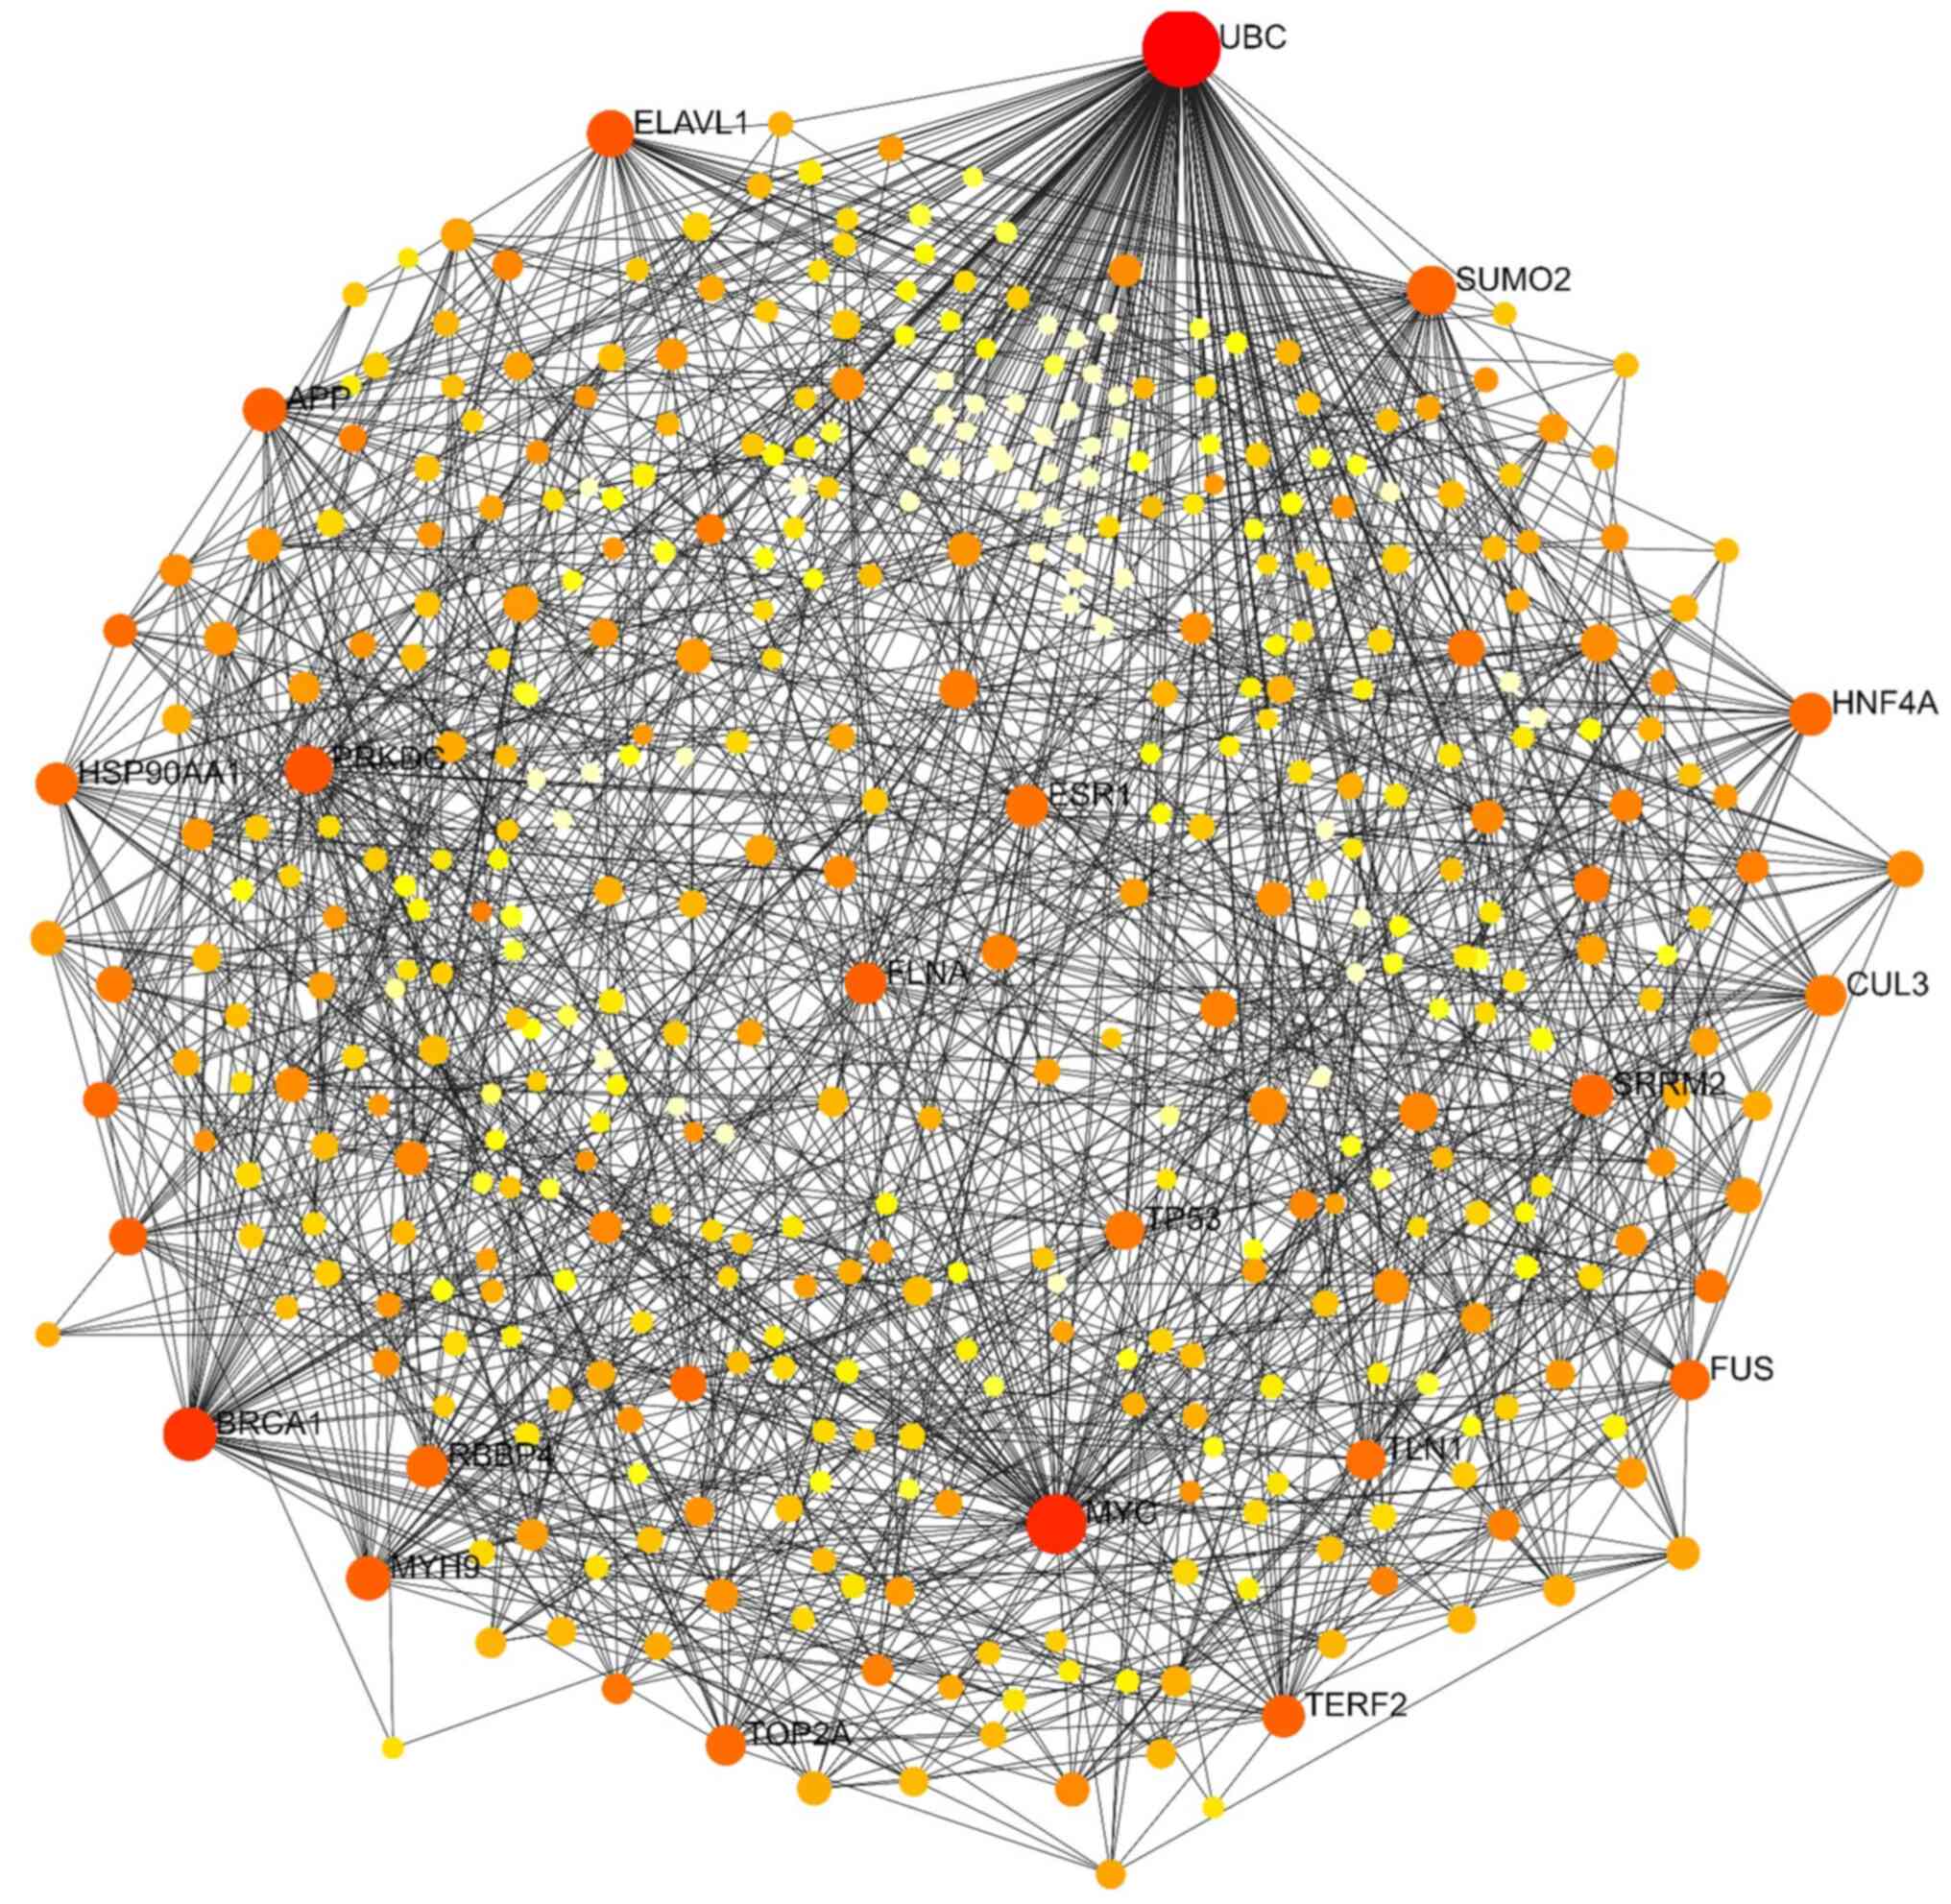
NetworkAnalyst was used to establish and visualize the PPI network, employing a minimum network approach to simplify and focus on core protein associations (12). This approach retained seed proteins and essential non-seed proteins, allowing the study of the key interactions among these proteins. A degree of >20 was set as the cut-off criterion. The upregulated genes included 305 nodes, 825 edges and 178 seeds. The top ten proteins in the PPI network of these genes were ubiquitin C (UBC), breast cancer gene 1 (BRCA1), lymphocyte cell-specific protein-tyrosine kinase (LCK), Janus kinase 1 (JAK1), ATR serine/threonine kinase (ATR), structural maintenance of chromosomes 3 (SMC3), regulatory associated protein of MTOR complex 1 (RPTOR), cell division cycle 27 (CDC27), phospholipase C beta 3 (PLCB3) and vasodilator stimulated phosphoprotein (VASP) (Fig. 3). The PPI network of downregulated genes comprised 113 nodes, 256 edges and 75 seeds. The top five proteins in this network, UBC, protein kinase, DNA-activated, catalytic subunit (PRKDC), V-Myc avian myelocytomatosis viral oncogene homolog (MYC), tumor protein P53 (TP53) and P21 (RAC1) activated kinase 1 (PAK1), were considered hub genes for downregulated DEGs (Fig. 4). Combining upregulated and downregulated genes in a PPI network resulted in 434 nodes, 1,457 edges and 254 seeds. As revealed in Table IV and Fig. 5, UBC exhibited the highest degree and betweenness values in this network, followed by MYC, BRCA1, PRKDC, embryonic lethal, abnormal vision, Drosophila, homolog-like 1 (ELAVL1), myosin heavy chain 9 (MYH9), amyloid beta precursor protein (APP), telomeric repeat binding factor 2 (TERF2), LCK and filamin A (FLNA).
Discussion
Through the present study, the identification of unique protein patterns between AM and DF, which may have been engaged in the process of transforming from DF to AM at the scale of proteins, was achieved. Changes in biological processes and major signaling transductions that play crucial roles in AM were also investigated. These observations were based on the protein patterns that were analyzed.
The biological function analysis findings highlighted upregulation of H2A monoubiquitination and actin filament-based movement in AM. H2A monoubiquitination, a key histone modification, occurs when a particular lysine residue in the core histone protein H2A is taken by a single ubiquitin molecule. This process is crucial for regulating gene expression and chromatin structure, affecting DNA packaging and gene accessibility to transcription factors and regulatory proteins (14,15). To the best of the authors' knowledge, the role of H2A monoubiquitination in AM has not been explored. However, similar to other tumors, it may play a role in governing oncogene and tumor suppressor gene expression via chromatin access, as well as guiding their cellular differentiation from DF (16).
Actin filaments are essential components of the cell cytoskeleton, playing a key role in cellular processes such as motility. They are essential for functions such as cell migration, muscle contraction, cytokinesis and cell division (17). Although actin filaments and cell motility are fundamental processes in biology, they are not directly linked to AM formation or development (18). The invasive behavior of AM, infiltrating healthy tissues, is a distinctive feature contributing to its progression (3). Changes in tumor cell adhesion molecules may contribute to invasiveness, influencing tumor growth and tissue invasion (19). Among these changes, the loss or dysregulation of different cell adhesion molecules is significant because the biological processes underlying odontogenic tumors depend on cell adhesion (20). However, additional investigation of these pathway changes at the molecular level of AM development and progression must be further explored.
Pathway enrichment analysis identified ‘platelet activation’ and the ‘Rap1 signaling pathway’ as the top-ranked pathways associated with AM-upregulated proteins. Platelet activation is an important part of hemostasis and thrombosis. Activated platelets stick to sites of vascular damage to form blood clots, which stop excessive bleeding (21). A prior study indicated higher expression of platelet-derived endothelial cell growth factor/thymidine phosphorylase (PD-ECGF/TP) in AM compared with the DF (22). In addition, PD-ECGF/TP reactivity was observed in granular cell AM (23), which suggested that it is involved in both tumor and normal cells. This indicated that angiogenic factors play a part in the development of ameloblasts.
The Rap1 signaling pathway regulates cell adhesion, proliferation and migration. Specifically, it regulates integrins and cadherins, promoting cell-cell and extracellular matrix adhesion (24). In the context of tumor invasion and metastasis, matrix metalloproteinases (MMPs) break down extracellular matrix barriers, cleave and activate specific target proteins, and influence cell adhesion processes. In head and neck squamous cell carcinoma, it was revealed that Rap1 involvement in promoting β-catenin nuclear localization triggered T-cell factor-dependent transcription of MMP7, contributing to tumor cell invasion (25). Although Rap1 signaling is a pivotal pathway implicated in various diseases, its specific association with AM has not been documented, necessitating further study of Rap1 signaling mechanisms.
It was determined that the prominent pathway associated with downregulated genes in AM involves proteoglycans. Proteoglycans, comprising a core protein and lengthy carbohydrate chains known as glycosaminoglycans, play a crucial role in the extracellular matrix. They provide structural support and regulate cellular behavior (26). By interacting with growth factors, cytokines and signaling molecules, proteoglycans influence cell proliferation, migration and differentiation (27). Alterations in the extracellular matrix, including changes in proteoglycans, have significant implications for tumor progression, invasion and metastasis in cancer. However, the specific roles of proteoglycans can vary substantially in different cancer types (28). Proteoglycans also contribute significantly to odontogenesis, as evidenced by their involvement in cell differentiation stages during human and animal tooth development models (29). Some proteoglycan genes, initially silenced during tooth development, reactivate in some odontogenic tumors (30). This reactivation is associated with tumor-related processes such as growth, invasion and the loss of cell adhesion, highlighting the role of proteoglycans in tumorigenesis (31). In summary, the proteoglycan pathway appears to be crucial in the etiology of AM.
The term ‘hub gene’ refers to a gene that holds a central position in a biological network or system (32). In molecular biology and genetics, it typically signifies a gene with numerous connections or interactions within a pathway or network. Hub genes provide valuable insights into the molecular mechanisms associated with cancer development, progression and treatment response (32,33). In the present study, UBC and MYC were identified as hub genes with the highest degree values. Exploring their roles in AM could unveil potential therapeutic targets and guide the development of personalized treatment strategies.
The UBC gene encodes ubiquitin C and has emerged as the top-ranked hub gene from the PPI network analysis. Ubiquitin acts as either an oncogene or a tumor suppressor gene in various cancers and is involved in crucial cellular processes such as protein localization, the cell cycle, transcription, DNA damage repair and endocytosis (34). In tumors, the P53 protein is primarily located in the nucleoplasm, where it binds specifically to DNA. It facilitates gene repair and undergoes post-translational changes, including phosphorylation, acetylation, methylation and ubiquitination (35). While the specific role of UBC in AM has not been reported, the findings of the present study indicated that UBC may potentially contribute to the disease, underscoring the importance of further exploration into the associated mechanisms of this gene.
In the PPI network analysis, MYC was identified as a key hub gene. Notably, c-MYC plays a role in promoting oncogene-induced senescence, a critical process in tumor suppressor mechanisms that helps prevent cell transformation (36). Previous research has established a connection between telomerase activity and both oncogenesis and odontogenic epithelial proliferation. Additionally, there is evidence suggesting that the c-MYC protein may act as a regulator of telomerase activity in AM (37).
One limitation of this research lies in the assessment of a limited number of patients. A study conducted across multiple centers or recruiting a substantial number of participants would yield a greater quantity of data and higher-quality results. Another limitation is the potential exclusion of proteins with low abundance or hydrophilic properties from the results. LCMS/MS with electrospray ionization generates multiple-charged ions, leading to the loss of single-charged ions (38). Consequently, certain proteins with low abundance may be omitted from the protein records. One notable example is BRAF V600E, which is currently recognized for its role in mandibular AM tumorigenesis (39,40).
In summary, through the PPI network analysis, novel hub genes associated with AM were discovered. Notably, UBC, BRCA1, LCK, JAK1, ATR, PRKDC, MYC, TP53 and PAK1 were identified as common hub genes. The critical biological pathways involved in AM were ‘histone H2A monoubiquitination’ and ‘actin filament-based movement’. Further investigation into these essential hub genes and pathways is necessary in order to facilitate the development of practical applications that will be of assistance in the treatment of individuals afflicted with AM.
Supplementary Material
Detailed data of ameloblastoma and dental follicle.
Acknowledgements
The authors would like to express their gratitude to the Functional Proteomics Technology Laboratory, National Center for Genetic Engineering and Biotechnology (Pathumthani, Thailand) for providing the facilities and laboratory equipment.
Funding
Funding: The present study was supported by Mahidol University, Faculty of Dentistry Grant (grant no. DTRS-EG-2021-04).
Availability of data and materials
The datasets used and/or analyzed during the current study are available from the corresponding author on reasonable request.
Authors' contributions
SS and NK conceived the study, designed the experiments, confirm the authenticity of all the raw data, analyzed the data and wrote the manuscript. SS, SK, SC and SR performed experiments and interpreted data. NK and BK recruited the patients and collected the clinical samples. All authors have read and approved the final version of the manuscript.
Ethics approval and consent to participate
The present study was approved by the Institutional Review Board of the Faculty of Dentistry/Faculty of Pharmacology, Mahidol University, Bangkok, Thailand (approval no. COA.NO.MU-DT/PY-IRB 2021/034.3003) and was conducted in accordance with the Declaration of Helsinki (1975), as revised in 2013. Written informed consent was obtained from all patients.
Patient consent for publication
Not applicable.
Competing interests
The authors declare that they have no competing interests.
References
|
Ghai S: Ameloblastoma: An updated narrative review of an enigmatic tumor. Cureus. 14(e27734)2022.PubMed/NCBI View Article : Google Scholar | |
|
Vered M and Wright JM: Update from the 5th edition of the World Health Organization classification of head and neck tumors: Odontogenic and maxillofacial bone tumours. Head Neck Pathol. 16:63–75. 2022.PubMed/NCBI View Article : Google Scholar | |
|
Effiom OA, Ogundana OM, Akinshipo AO and Akintoye SO: Ameloblastoma: Current etiopathological concepts and management. Oral Dis. 24:307–316. 2018.PubMed/NCBI View Article : Google Scholar | |
|
Brown NA and Betz BL: Ameloblastoma: A review of recent molecular pathogenetic discoveries. Biomark Cancer. 7 (Suppl 2):S19–S24. 2015.PubMed/NCBI View Article : Google Scholar | |
|
Chakraborty S, Hosen MI, Ahmed M and Shekhar HU: Onco-multi-OMICS approach: A new frontier in cancer research. Biomed Res Int. 2018(9836256)2018.PubMed/NCBI View Article : Google Scholar | |
|
Sallam RM: Proteomics in cancer biomarkers discovery: Challenges and applications. Dis Markers. 2015(321370)2015.PubMed/NCBI View Article : Google Scholar | |
|
Fernández-Puente P, Mateos J, Blanco FJ and Ruiz-Romero C: LC-MALDI-TOF/TOF for shotgun proteomics. Methods Mol Biol. 1156:27–38. 2014.PubMed/NCBI View Article : Google Scholar | |
|
Darie-Ion L, Whitham D, Jayathirtha M, Rai Y, Neagu AN, Darie CC and Petre BA: Applications of MALDI-MS/MS-based proteomics in biomedical research. Molecules. 27(6196)2022.PubMed/NCBI View Article : Google Scholar | |
|
Cui Y, Li H, Xiao T, Zhang X, Hou Y, Li H and Li X: A proteomics study to explore differential proteins associated with the pathogenesis of ameloblastoma. J Oral Pathol Med. 52:528–538. 2023.PubMed/NCBI View Article : Google Scholar | |
|
Kuleshov MV, Jones MR, Rouillard AD, Fernandez NF, Duan Q, Wang Z, Koplev S, Jenkins SL, Jagodnik KM, Lachmann A, et al: Enrichr: A comprehensive gene set enrichment analysis web server 2016 update. Nucleic Acids Res. 44 (W1):W90–W97. 2016.PubMed/NCBI View Article : Google Scholar | |
|
Harris MA, Clark J, Ireland A, Lomax J, Ashburner M, Foulger R, Eilbeck K, Lewis S, Marshall B, Mungall C, et al: The gene ontology (GO) database and informatics resource. Nucleic Acids Res. 32 (Database Issue):D258–D261. 2004.PubMed/NCBI View Article : Google Scholar | |
|
Zhou G, Soufan O, Ewald J, Hancock REW, Basu N and Xia J: NetworkAnalyst 3.0: A visual analytics platform for comprehensive gene expression profiling and meta-analysis. Nucleic Acids Res. 47 (W1):W234–W241. 2019.PubMed/NCBI View Article : Google Scholar | |
|
Szklarczyk D, Gable AL, Lyon D, Junge A, Wyder S, Huerta-Cepas J, Simonovic M, Doncheva NT, Morris JH, Bork P, et al: STRING v11: Protein-protein association networks with increased coverage, supporting functional discovery in genome-wide experimental datasets. Nucleic Acids Res. 47 (D1):D607–D613. 2019.PubMed/NCBI View Article : Google Scholar | |
|
Zhang Y, Sun Z, Jia J, Du T, Zhang N, Tang Y, Fang Y and Fang D: Overview of histone modification. Adv Exp Med Biol. 1283:1–16. 2021.PubMed/NCBI View Article : Google Scholar | |
|
Cao J and Yan Q: Histone ubiquitination and deubiquitination in transcription, DNA damage response, and cancer. Front Oncol. 2(26)2012.PubMed/NCBI View Article : Google Scholar | |
|
Guo XE, Ngo B, Modrek AS and Lee WH: Targeting tumor suppressor networks for cancer therapeutics. Curr Drug Targets. 15:2–16. 2014.PubMed/NCBI View Article : Google Scholar | |
|
Tang DD and Gerlach BD: The roles and regulation of the actin cytoskeleton, intermediate filaments and microtubules in smooth muscle cell migration. Respir Res. 18(54)2017.PubMed/NCBI View Article : Google Scholar | |
|
Nishikawa S: Cytoskeleton, intercellular junctions, planar cell polarity, and cell movement in amelogenesis. J Oral Biosci. 59:197–204. 2017. | |
|
Kiefel H, Bondong S, Hazin J, Ridinger J, Schirmer U, Riedle S and Altevogt P: L1CAM: A major driver for tumor cell invasion and motility. Cell Adh Migr. 6:374–384. 2012.PubMed/NCBI View Article : Google Scholar | |
|
Nagi R, Sahu S and Rakesh N: Molecular and genetic aspects in the etiopathogenesis of ameloblastoma: An update. J Oral Maxillofac Pathol. 20:497–504. 2016.PubMed/NCBI View Article : Google Scholar | |
|
Periayah MH, Halim AS and Saad AZ: Mechanism action of platelets and crucial blood coagulation pathways in hemostasis. Int J Hematol Oncol Stem Cell Res. 11:319–327. 2017.PubMed/NCBI | |
|
Khalele BAEO and Al-Shiaty RA: A novel marker of ameloblastoma and systematic review of immunohistochemical findings. Ann Diagn Pathol. 22:18–24. 2016.PubMed/NCBI View Article : Google Scholar | |
|
Nikitakis NG, Tzerbos F, Triantafyllou K, Papadimas C and Sklavounou A: Granular cell ameloblastoma: An unusual histological subtype report and review of literature. J Oral Maxillofac Res. 1(e3)2011.PubMed/NCBI View Article : Google Scholar | |
|
Zhang YL, Wang RC, Cheng K, Ring BZ and Su L: Roles of Rap1 signaling in tumor cell migration and invasion. Cancer Biol Med. 14:90–99. 2017.PubMed/NCBI View Article : Google Scholar | |
|
Jia Z, Yang Y, Dengyan Z, Chunyang Z, Donglei L, Kai W and Song Z: RAP1B, a DVL2 binding protein, activates Wnt/beta-catenin signaling in esophageal squamous cell carcinoma. Gene. 611:15–20. 2017.PubMed/NCBI View Article : Google Scholar | |
|
Pomin VH and Mulloy B: Glycosaminoglycans and proteoglycans. Pharmaceuticals (Basel). 11(27)2018.PubMed/NCBI View Article : Google Scholar | |
|
Hassan N, Greve B, Espinoza-Sánchez NA and Götte M: Cell-surface heparan sulfate proteoglycans as multifunctional integrators of signaling in cancer. Cell Signal. 77(109822)2021.PubMed/NCBI View Article : Google Scholar | |
|
Winkler J, Abisoye-Ogunniyan A, Metcalf KJ and Werb Z: Concepts of extracellular matrix remodelling in tumour progression and metastasis. Nat Commun. 11(5120)2020.PubMed/NCBI View Article : Google Scholar | |
|
Listik E, Azevedo Marques Gaschler J, Matias M, Neuppmann Feres MF, Toma L and Raphaelli Nahás-Scocate AC: Proteoglycans and dental biology: the first review. Carbohydr Polym. 225(115199)2019.PubMed/NCBI View Article : Google Scholar | |
|
Gómez-Herrera Z, Molina-Frechero N, Damián-Matsumura P and Bologna-Molina R: Proteoglycans as potential biomarkers in odontogenic tumors. J Oral Maxillofac Pathol. 22:98–103. 2018.PubMed/NCBI View Article : Google Scholar | |
|
Barkovskaya A, Buffone A Jr, Žídek M and Weaver VM: Proteoglycans as mediators of cancer tissue mechanics. Front Cell Dev Biol. 8(569377)2020.PubMed/NCBI View Article : Google Scholar | |
|
Yu D, Lim J, Wang X, Liang F and Xiao G: Enhanced construction of gene regulatory networks using hub gene information. BMC Bioinformatics. 18(186)2017.PubMed/NCBI View Article : Google Scholar | |
|
Li CY, Cai JH, Tsai JJP and Wang CCN: Identification of hub genes associated with development of head and neck squamous cell carcinoma by integrated bioinformatics analysis. Front Oncol. 10(681)2020.PubMed/NCBI View Article : Google Scholar | |
|
Sun T, Liu Z and Yang Q: The role of ubiquitination and deubiquitination in cancer metabolism. Mol Cancer. 19(146)2020.PubMed/NCBI View Article : Google Scholar | |
|
Che Z, Sun H, Yao W, Lu B and Han Q: Role of post-translational modifications in regulation of tumor suppressor p53 function. Front Oral Maxillofac Med. 2:1–15. 2020. | |
|
Zhong M, Li Z, Wang J, Zhang B, Hou L and Gong YB: Expression of telomerase activity and c-myc and stimulatory protein 1 in human ameloblastoma. Hua Xi Kou Qiang Yi Xue Za Zhi. 22:499–502. 2004.PubMed/NCBI(In Chinese). | |
|
Acosta JC and Gil J: Senescence: A new weapon for cancer therapy. Trends Cell Biol. 22:211–219. 2012.PubMed/NCBI View Article : Google Scholar | |
|
Aebersold R and Mann M: Mass spectrometry-based proteomics. Nature. 422:198–207. 2003.PubMed/NCBI View Article : Google Scholar | |
|
da Silva Marcelino BMR, Parise GK, do Canto AM, Sassi LM, Sarmento DJS, Costa ALF, Hasséus B, Kjeller G, Schussel JL and Braz-Silva PH: Comparison of immunohistochemistry and DNA sequencing for BRAF V600E mutation detection in mandibular ameloblastomas. Appl Immunohistochem Mol Morphol. 29:390–393. 2021.PubMed/NCBI View Article : Google Scholar | |
|
Lapthanasupkul P, Laosuk T, Ruangvejvorachai P, Aittiwarapoj A and Kitkumthorn N: Frequency of BRAF V600E mutation in a group of Thai patients with ameloblastomas. Oral Surg Oral Med Oral Pathol Oral Radiol. 132:e180–e185. 2021.PubMed/NCBI View Article : Google Scholar |