


GBP2 enhances paclitaxel sensitivity in triple‑negative breast cancer by promoting autophagy in combination with ATG2 and inhibiting the PI3K/AKT/mTOR pathway
- Authors:
- Published online on: February 6, 2024 https://doi.org/10.3892/ijo.2024.5622
- Article Number: 34
-
Copyright: © Zhang et al. This is an open access article distributed under the terms of Creative Commons Attribution License.
Abstract
Introduction
Breast cancer is the most prevalent cancer in women worldwide (1); triple-negative breast cancer (TNBC), accounts for ~15% of all breast cancer cases, which has a dismal prognosis (2). TNBC is characterized by the absence of expression of estrogen receptor (ER), progesterone receptor (PR), and epidermal growth factor receptor 2 (ERBB2 or HER2) and exhibits significant intratumoral heterogeneity (3). Despite the improved survival rate of patients with ER+, PR+, or HER2+ breast cancer with the development of endocrine and targeted therapies (4), patients with TNBC encounter difficulties as there are no particular drug targets available (3). Patients with TNBC are primarily treated with chemotherapy.
Guanylate-binding protein 2 (GBP2), a member of the interferon-gamma (IFN-γ)-inducible GTPase superfamily, was identified for its protective effects against microorganisms (5). In studies on tumors, GBP2 was differentially expressed in various cancer cells (6-10). Although some studies have provided evidence of GBP2 involvement in breast cancer progression (11-13), the specific mechanisms underlying its role require further investigation.
Paclitaxel (PTX), a mitotoxic agent (14), is extensively used in TNBC chemotherapy due to its cytotoxic effects (15). However, drug resistance often leads to treatment failure. Multiple mechanisms contribute to the resistance of PTX in breast cancer, including drug efflux proteins of the ABC superfamily (16), MAP proteins, SACs (17), and epigenetic regulation by miRNAs (18). Among these mechanisms, PTX-induced protective autophagy is quite critical (19).
Autophagy is a dynamic process essential for maintaining cellular homeostasis; it can promote tumor cell survival through protective autophagy or trigger type II (autophagic) cell death (20). Autophagy and drug resistance have a complicated interaction, and different autophagy inhibitors and inducers have been identified to restore sensitivity to PTX in tumor cells, with efficacy influenced by tumor characteristics and progression stages (21). Existing studies have confirmed that autophagy activated by inhibition of the Ras-Raf, PI3K/AKT/mTOR signaling pathway results in increased PTX sensitivity, which in turn suppresses tumor cell growth (22,23).
The development of multiple tumors is strongly linked to autophagy, with autophagosome formation being a crucial step in this process (24). Autophagy-related protein 2 (ATG2) is responsible for the transmembrane transport of phospholipids and is essential for autophagosome formation (25). Recently, several proteins have been reported to regulate ATG2 transcription (26-28); however, the roles of GBP2 and ATG2 in autophagy have not yet been investigated, therefore exploring the relationship between the roles of GBP2 and ATG2 in autophagy may reveal new mechanistic insights to improve TNBC therapy.
Before studying the role of GBP2 and autophagy, results demonstrated that the concentration of PTX significantly affected the expression of GBP2; therefore, it was hypothesized that GBP2 may be related to PTX sensitivity through certain mechanism. Based on the knowledge that autophagy has a significant impact on drug-resistance in TNBC (29), it was reasonable to conduct a study on GBP2 and autophagy in order to further explore whether there was a tandem relationship between them and PTX sensitivity.
The present study verified the low level of GBP2 expression in TNBC and its inhibitory effects in vivo and in vitro. The function of GBP2 in regulating autophagy in TNBC cells was investigated and the mechanism by which GBP2 facilitates autophagy via inhibiting the PI3K/AKT/mTOR signaling pathway and interacting with ATG2 was elucidated. Furthermore, it was demonstrated that GBP2-activated autophagy reversed PTX resistance in TNBC, providing a promising strategy for overcoming resistance.
Materials and methods
Plotting of Kaplan-Meier (K-M) curves
In the present study, the expression data of GBP2 in breast cancer was queried from The Cancer Genome Atlas dataset (https://www.cancer.gov/ccg/research/genome-sequencing/tcga). The role of GBP2 in patient survival was assessed with the KM Plotter online database (http://kmplot.com/analysis/) using the log-rank test. 'Gene Symbol=GBP2' was entered, 'Jetset Best Probe Set' was selected, and 'Median' was used to classify patients. Then 'StGallen's classification' was selected, and survival analysis was performed for each subtype (including basal/luminal A/luminal B/HER2+).
Cell lines and cultures
MDA-MB-231 (cat. no. HTB-26) and MDA-MB-436 (cat. no. HTB-130) were selected to represent TNBC cell lines and MCF10A (CRL-10317) to represent a normal (non-carcinogenic) breast epithelial cell line. All cell lines were provided by The American Type Culture Collection. At 37°C and in 5% CO2-humidified air, all the cell lines were cultured in DMEM media (Gibco; Thermo Fisher Scientific, Inc.) supplemented with 10% fetal bovine serum, 100 g/ml penicillin and 100 U/ml streptomycin.
PTX-resistant MDA-MB-231/PR and MDA-MB-436/PR cells were developed by exposure to low doses of PTX (Selleck Chemicals) over an extended period. The dosage was gradually increased until reaching a concentration of 50 nM, which is the maximum recommended concentration for clinical use, to ensure the cells could survive consistently.
RNA transfection
The overexpressing (OE)-DNA sequence targeting GBP2 was cloned into the lentiviral vector (Shanghai GenePharma Co., Ltd.) to generate a stable cell line overexpressing GBP2. Empty load virus (provided by the same supplier) as negative control for transfection. The RNA sequences were as follows: GBP2-OE-DNA forward, 5′-GCGATCGCATGGCTCCAGAGATCAACT-3′ and reverse, 5′-ACGCGTGAGTATGTTACATATTGGCT-3′ (Underlined are Restriction Enzyme cutting site). A total of 1.5 μg of pBI-GBP2-EGFP vector (cat. no. 6154-1; BD Biosciences), which expresses GBP2 with the C-terminal EGFP tag, and 2 μg of pIRESpuro plasmid (cat. no. KL101-994; Shanghai kanglang biological technology Co., Ltd.) were co-transfected into 293T cells (Shanghai GenePharma Co., Ltd.) to generate the lentivirus. In addition, the two vectors were also cotransfected with 1 μg of psPAX2 (cat. no. P0261) and pMD2.G (cat. no. P0262; both from miaolingbio) viral packaging plasmids during transfection. After incubation in a 37°C cell culture incubator for about 48 h, filtered viral supernatant could be collected and stored at -20°C. Based on the screening of positive resistant cell lines, the encapsidated lentivirus generated in the supernatant of their culture was collected to transfect TNBC cells to obtain stable GBP2 overexpressing cell lines. Briefly, seeding ~0.5-1×10⁶ TNBC cells each in 10-cm2 tissue culture plates until the confluent prior reached to 40-50%, then polybrene medium (target cell medium) mix were prepared (8 μg/ml). The medium in the target cells was aspirated using Pasteur pipette and 1 ml polybrene medium mix was added and then incubated for ~1-2 min. Next, lentivirus was picked out and thawed in a 37°C water bath before adding it to the TNBC cells. A total of 9 ml of lentiviral mix were added. When puromycin was present at a concentration of 0.5 mg/ml, puromycin-resistant clones were chosen after incubation for 48 h. Utilizing reverse transcription quantitative PCR (RT-qPCR) and western blotting (WB), the inducibility of the GBP2-EGFP fusion protein in the chosen clones was evaluated.
RT-qPCR
The relative GBP2 mRNA expression was calculated by RT-qPCR, using the 2−ΔΔCq method for quantification (30). The cells were treated according to the manufacturer's instructions to extract total RNA using a TRIzol reagent (cat. no. 15596018; Thermo Fisher Scientific, Inc.). According to the manufacturer's instructions, extracted RNA was then reverse-transcribed into cDNA using a cDNA synthesis kit from Fermentas; Thermo Fisher Scientific, Inc. The SYBR Premix Ex Taq Master Mix (cat. no. PR820A; Takara Bio, Inc.) was used to conduct qPCR. Thermocycling conditions were as follows: 95°C for 30 sec; 95°C for 5 sec; 55°C for 30 sec; and 72°C for 30 sec, 40 cycles in total. The chosen endogenous control was β-actin. The primer pairs used for RT-qPCR were as follows: β-actin forward, 5′-TCA CCA ACT GGG ACG ACA-3′ and reverse, 5′-ACA GCC TGG ATA GCA ACG-3′; and GBP2 forward, 5′-CTA TCT GCA ATT ACG CAG CCT-3′ and reverse, 5′-TGT TCT GGC TTC TTG GGA TGA-3′.
WB
Total protein within cells was extracted with precooled RIPA lysate (cat. no. P0013B; Beyotime Institute of Biotechnology) and quantified using a BCA kit (cat. no. 23227; Thermo Fisher Scientific, Inc.). Protein was denatured first with incubation at 100°C for 5 min, and then 20 μl was added to 10% SDS-PAGE gel for electrophoresis at 80 and 120 V for 30 and 90 min. The PVDF membranes were blocked with 5% skimmed milk before incubating with primary antibodies (1:1,000) overnight at 4°C, then the secondary antibodies (1:5,000; cat. no. ab150077; Abcam) were incubated for 1 h at room temperature. Under the application of increased chemiluminescence (cat. no. 34002; Thermo Fisher Scientific, Inc.), the membranes were visualized under a gel imaging system (Tanon Co., Ltd.) and gray value analysis was based on ImageJ software (version 2.0.0; National Institutes of Health). The primary antibodies listed below were employed: anti-β-actin (cat. no. A5441), anti-p62 (cat. no. SAB5700845), anti-LC3I/II (cat. no. L8918; all from Sigma-Aldrich; Merck KGaA), anti-GBP2 (cat. no. 11854-1-AP), anti-ATG2 (cat. no. 23226-1-AP), anti-ATG5 (cat. no. 10181-2-AP; all from Proteintech Group, Inc.), anti-PI3K (cat. no. 4292), anti-Phospho-PI3K (cat. no. 4228), anti-Akt (cat. no. 9272), anti-Phospho-Akt (cat. no. 9271), anti-AMPK (cat. no. 2532), anti-Phospho-AMPK (cat. no. 2531), anti-mTOR (cat. no. 2972), anti-Phospho-mTOR (cat. no. 2971), anti-ULK1 (cat. no. 8054) and anti-Phospho-ULK1 (cat. no. 5869; all from Cell Signalling Technology, Inc.).
Colony formation assay
A total of 1,000 cells/well were inoculated in 6-well culture plates. The medium was renewed every 3 days and the culture was continued until 14 days or until the number of cells in the majority of individual clones was >50. After fixation by adding 1 ml of 4% paraformaldehyde to each well for 30 min at 20°C, the cells were observed and images were captured under a Nikon microscope (Nikon Corporation).
Cell Counting Kit-8 (CCK-8) assay
96-well plates containing transfected cells were planted with 1×10⁴ cells per well. Then, each well received 100 ml of diluted CCK-8 solution (cat. no. CK04; Dojindo Laboratories, Inc.) and was incubated at 37°C for 4 h. The optical density (OD) was measured at 450 nm. For assessing cell viability, the OD value of each group was recorded at fixed time points, calculating relative cell viability as follows: Relative cell viability=(ODt-OD0)/OD0, where ODt represents the optical density value of each well at the given time point, and OD0 is the optical density value of the cell culture solution at the start of incubation (0 h). IC50 values were calculated after the relative viability curves plotted after 24 h of treatment with equal gradient concentrations of PTX were completed.
5-ethynyl-2′-deoxyuridine (EDU) assay
Following the directions from the manufacturer, tumor pieces were found using an EDU immunofluorescence labeling test (cat. no. 15176-29-1; Sigma-Aldrich, Merck KGaA). The cells were exposed to 50 mM EDU for a duration of 6 h before fixing, permeabilizing and staining with EDU in accordance with the manufacturer's instructions. The cell nuclei were dyed for 20 min with 1 mg/ml of DAPI (Sigma-Aldrich; Merck KGaA). Fluorescence microscope (Nikon 80i; Nikon Corporation) was used to observe the cells containing EDU.
Matrigel invasion assay
The upper chamber of the Transwell plate (cat. no. 3422; Corning, Inc.) was filled with 25 μl of diluted Matrigel (cat. no. YZ-354234; Becton, Dickinson and Company), covered with a polycarbonic membrane (cat. no. 3428; Corning, Inc.), and subsequently polymerized into a gel by incubating at 37°C for 30 min. Next, 4×10⁴ cells starved for 24 h were planted in medium without serum in the inserts. Cell invasion caused by cell proliferation was less likely to happen when the cells were cultured in a medium without serum. The inserts were stored in 24-well plates containing DMEM and 10% FBS at 37°C for 24 h. The invasive cells were located at the bottom side of the membrane in the inserts. These cells were fixed with ice-cold methanol for 10 min at 20°C and then stained for 20 min with a solution of 0.2% crystal violet at room temperature. A Nikon digital camera was used to count the number of marked cells on the membrane.
Gap closure test
Cell migration was assessed using the gap closure assay. Culture insert wells were injected with cells that were in the logarithmic growth phase. In an incubator, cells were cultured for 24 h. Using sterile forceps, the insert was carefully removed, and 1 ml of serum-free media was introduced to each well. At 0 and 24 h after gap closure, the experimental field of view was observed under a Nikon microscope (Nikon Corporation).
Transmission electron microscopy
The specimens underwent a treatment using 2.5% glutaraldehyde in a solution of 0.1 M sodium cacodylate and were subsequently kept at a temperature of 4°C before being embedded. Following this, they were subjected to a post-fixation process utilizing 1% osmium tetroxide and underwent a gradual dehydration procedure utilizing ethanol and propylene oxide. Following embedding, an ultramicrotome (LKB-I) was used to cut ultrathin (55-60 nm) sections from the samples. Samples were viewed utilizing the electron microscope (JEM-1200EX) after staining.
Immunofluorescence staining and confocal fluorescence microscopy
Cells were fixed for 20 min at 20°C with 100% ice-cold methanol. The slides were then blocked with closure buffer (1 PBS/5% normal serum/0.3% Triton X-100) for 1 h at 4°C. Then, cells were treated with specific primary antibody (1:200), and kept at the temperature of 4°C for an overnight period, followed by 1 h at 25°C with an Alexa Fluor 488-conjugated goat anti-rabbit IgG secondary antibody (1:1,000). The 4′,6-diamidino-2-phenylindole dye was used to stain the nuclei for 5 min at room temperature before blocking them with Antifade Reagent. Finally, a confocal fluorescence microscope (STELLARIS 5; Leica Microsystems, Inc.) was used to gather and evaluate images. The tumors were stained with immunofluorescence in accordance with the manufacturer's instructions (Wuhan Servicebio Technology Co., Ltd.).
The mRFP-GFP-LC3 lentivirus (Hanbio Biotechnology Co., Ltd.) transfection was utilized to identify and track LC3 in order to track the autophagic flux. According to the manufacturer's recommendations, cells were infected for 48 h with a tandem fluorescent mRFP-GFP-tagged adenovirus. Confocal fluorescence microscopy was used to capture the images. Red (RFP signal alone) and yellow (merge of GFP and RFP signal) puncta depict early and late autolysosomes, respectively. The color shift of GFP/mRFP was used to assess autophagic flow.
Xenotransplantation studies
A total of 48 SPF grade female BALB/c nude mice, aged 4 weeks and weighing between 16-20 g, were used in the present study. The mice were randomly assigned to either the experimental group or the control group. In the experimental group, a 100-μl cell suspension prepared in PBS (1×10⁷ cells) was injected, while in the control group, an equivalent dose of physiological saline was administered. Then, each group of mice was subjected to identical culture conditions, with a 12/12-h light-dark cycle and controlled temperature maintained at 22-25°C for optimal growth, while maintaining a relative humidity range of 40~60%. Calipers were used to measure tumor growth, and the tumor volume was calculated as follows: Tumor volume (mm3)=[width (mm)]2 × length (mm) ×0.5. Immunofluorescence, EDU labeling, and electron microscopy were all applied to the tumor sections. On the 35th day following the placement of the tumor, intraperitoneal injections of mice with 150 mg/kg sodium pentobarbital were performed following the euthanasia guidelines of the Group Standard of the Chinese Society of Laboratory Animals (T/CALAS 31-2017). Animal studies were approved (approval no. 2022-0016) by The Animal Experimentation Ethics Committee of Chongqing Medical University approved (Chongqing, China).
Patient studies
The specimens used for immunohistochemistry in the study were obtained from patients with confirmed TNBC, with an age range of 45-68 years old, recruited at the First Hospital of Chongqing Medical University (Chongqing, China), and the recruitment period was from January 2020 to January 2022, totaling two years. Approval for the utilization of clinical samples (approval no. 2020-279) was granted by The Review Board of the First Affiliated Hospital of Chongqing Medical University (Chongqing, China). Written informed consent for participation in the present study was provided by all patients.
Specialty solvents
In some experiments, DMSO (cat. no. D2650; Sigma-Aldrich; Merck KGaA) was used to configure Compound C (CC; cat. no. HY-13418A; MedChemExpress); Chloroquine (CQ; cat. no. C6628; Sigma-Aldrich; Merck KGaA) reagent was used to treat MDA-MB-231 cells for 24 h. The concentration of CC was 7.5 μmol/ml, and the concentration of CQ was 50 μmol/l.
Statistical analysis
The SPSS Statistics 25 (IBM Corp.) was used to conduct statistical analysis. The immunofluorescence data were analyzed using ImageJ software. Pearson correlation coefficients were subsequently calculated to quantify the degree of co-localization between the two proteins as previously described (31). The Cancer Genome Atlas dataset (https://www.ncbi.nlm.nih.gov/projects/gap/cgi-bin/study.cgi?study_id=phs001709.v1.p1) was analyzed to compare the expression levels of GBP2 in breast cancer tissues vs. normal breast tissues (https://portal.gdc.cancer.gov/projects/CMI-MBC). The results of at least three independent experiments are reported as the mean ± standard deviation. Using the Student's t-test, differences across groups were examined. P<0.05 was considered to indicate a statistically significant difference.
Results
GBP2 expression is downregulated in patients with TNBC and is associated with poor prognosis
First, it was confirmed that the expression level of GBP2 was significantly lower in breast cancer tissues compared with normal tissues (P<0.001). (Fig. 1A). Comparison of the expression levels of GBP2 in various subtypes of breast cancer with those in normal breast tissue revealed that GBP2 expression was low and statistically different in TNBC (basal) (Fig. 1B). The role of GBP2 in patient survival was assessed using the KM Mapper database (http://kmplot.com/analysis/),which demonstrated that patients with low expression of GBP2 had a significantly lower relapse-free survival rate (P=2.8×10⁻⁵), and not all patients with lower GBP2 expression had a significantly decreased recurrence-free survival rate in each subtype, but the subtype basal (log-rank P=3.6×10⁻⁶) was statistically different (Fig. 1C), suggesting that that low GBP2 level is predictive of a poor prognosis in TNBC (basal) subtype.
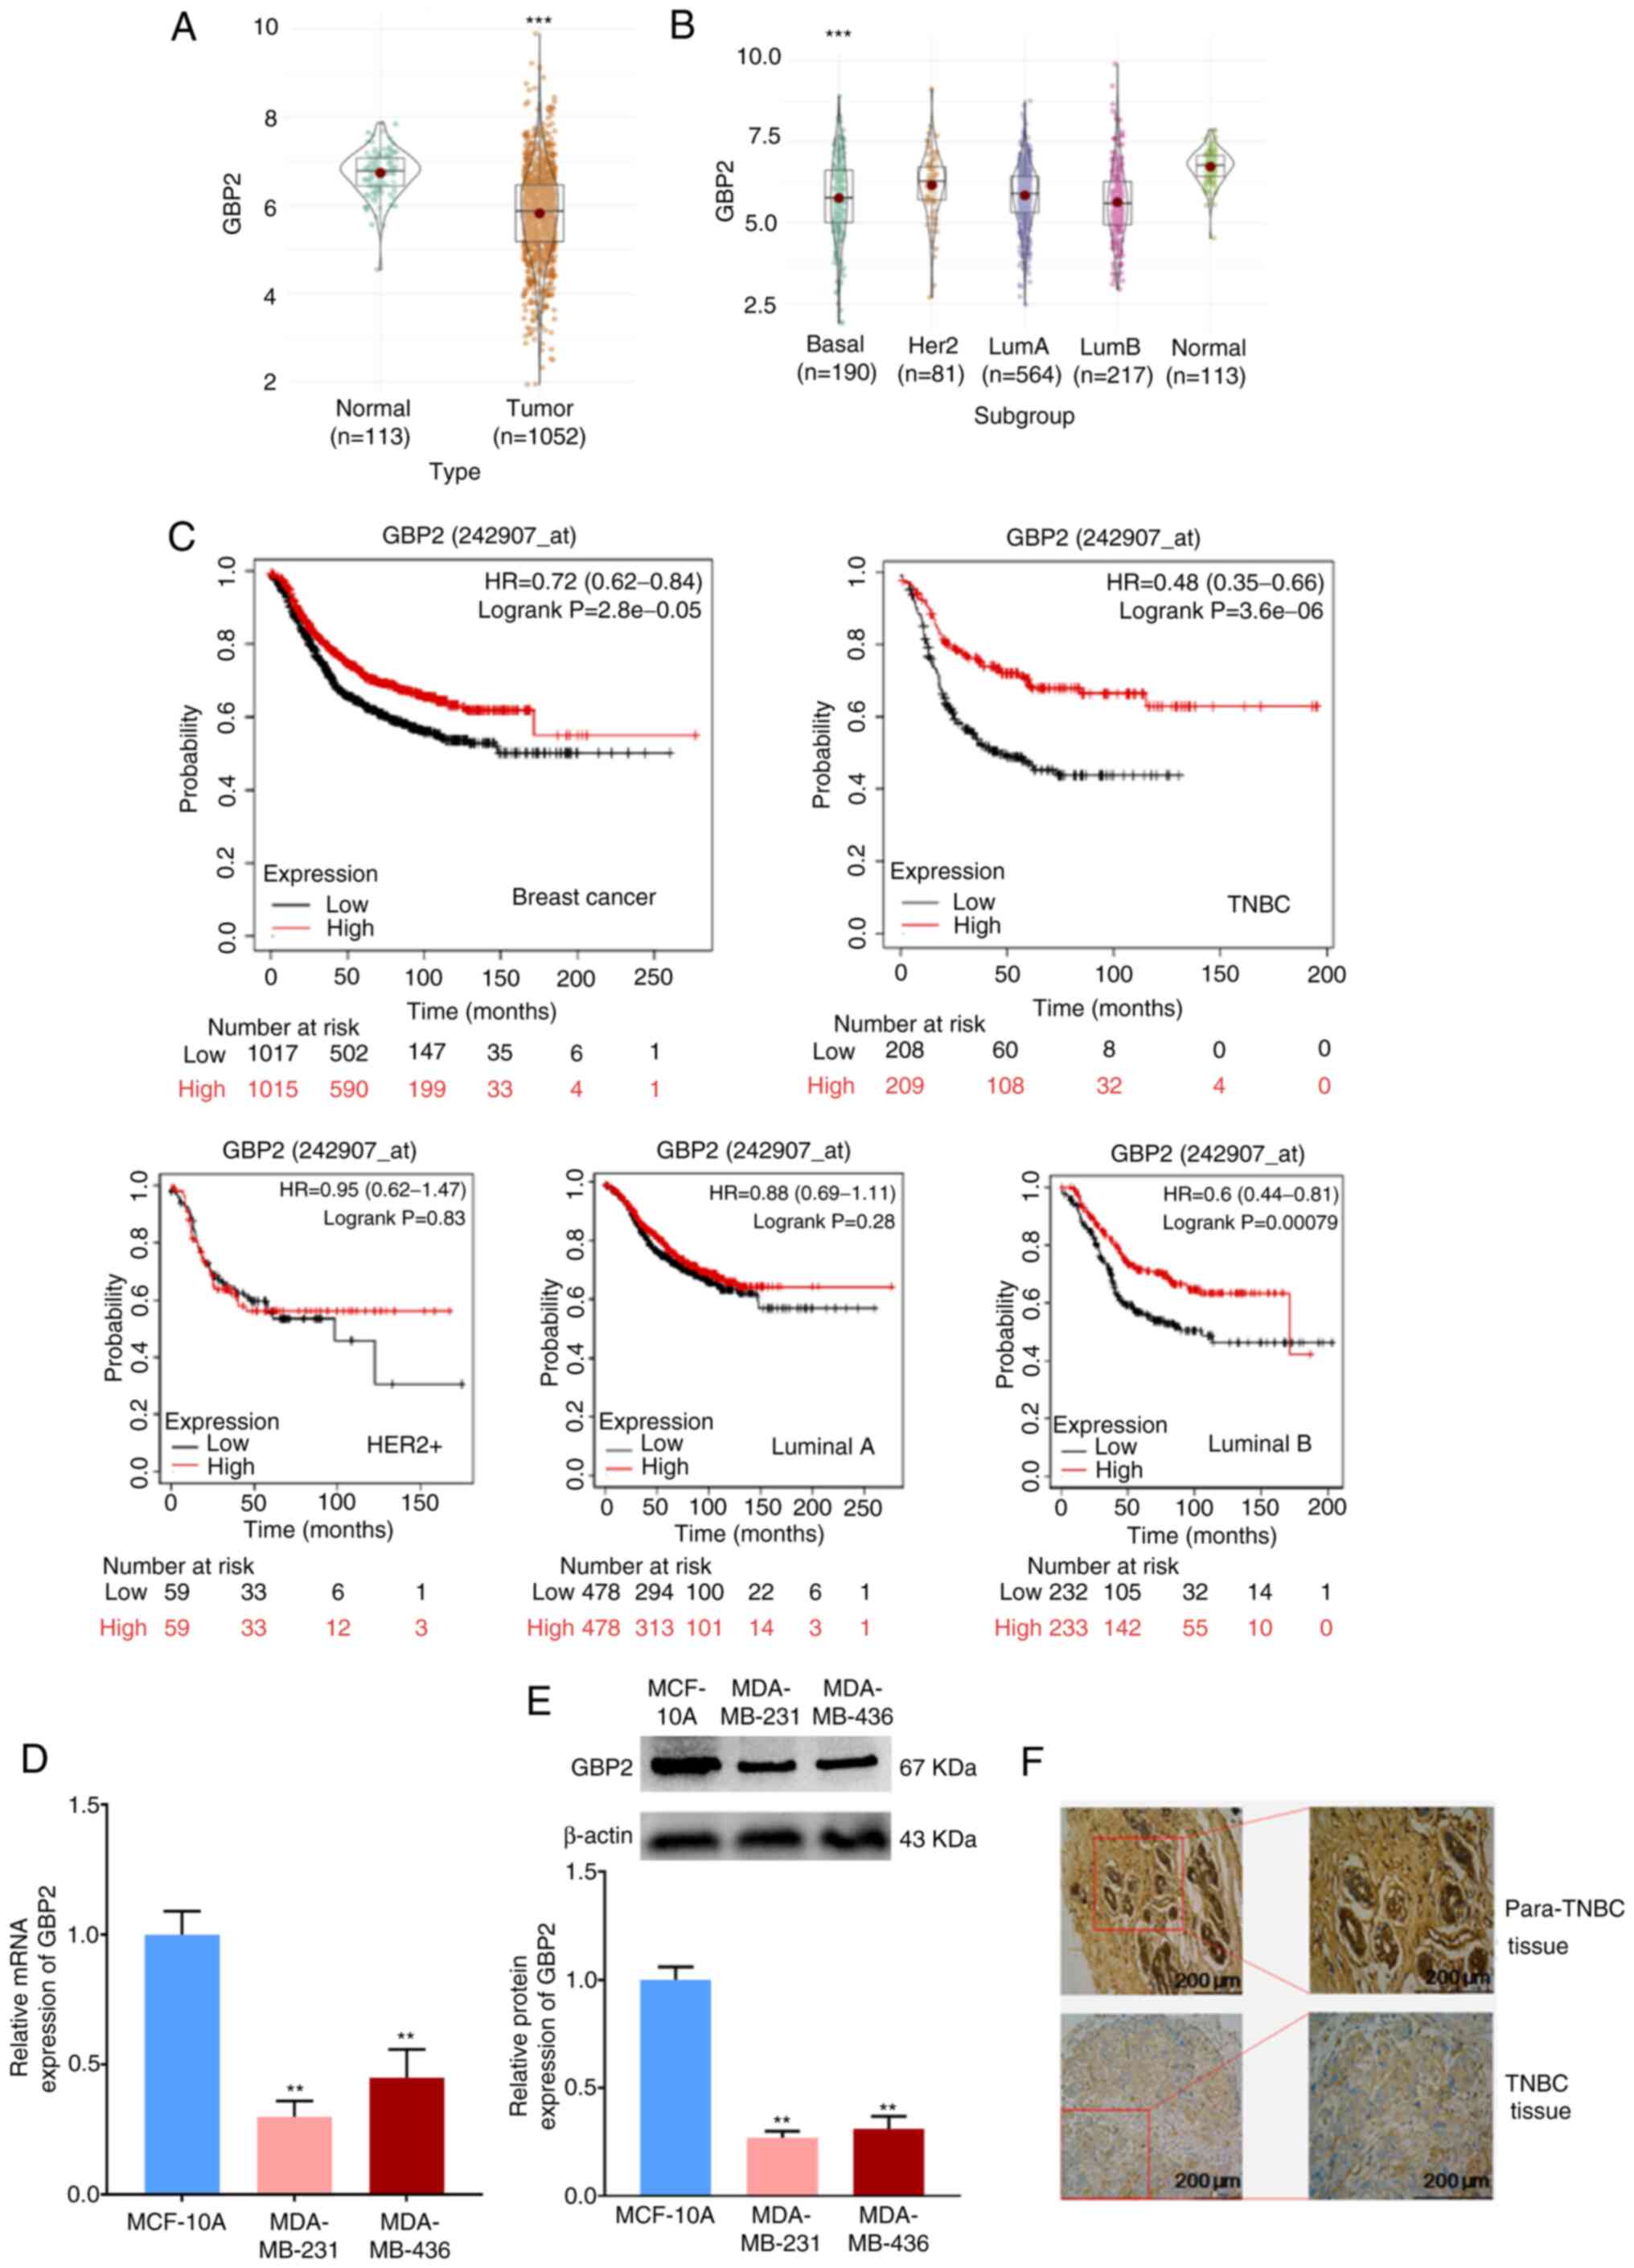
MDA-MB-231 and MDA-MB-436 cells were chosen as experimental cell lines, whereas MCF10A cells were designated as the control cell line. The use of RT-qPCR assay to detect the mRNA level of GBP2 transcripts (Fig. 1D) and WB assay to detect GBP2 protein (Fig. 1E) demonstrated the significantly low expression of GBP2. Finally, immunohistochemical experiments (Fig. 1F) using paraffin specimens of cancer and paracancerous tissues from patients with TNBC identified that TNBC cells expressed GBP2 at a considerably lower level.
GBP2 overexpression suppresses the proliferation, invasion and metastasis of TNBC cells
For further comprehension of GBP2's function in TNBC, MDA-MB-231 and MDA-MB-436 cells were stably transfected with GBP2-OE lentivirus. The transfection efficiency of lentivirus overexpressing GBP2 was evaluated in advance and the influence of other factors on transfection was eliminated (Fig. S1A). After screening as specified, the mRNA and protein expression levels of GBP2 were significantly higher (Fig. 2A-C), suggesting that GBP2 was successfully stably transfected. MDA-MB-231 and MDA-MB-436 cells overexpressing GBP2 are termed OE group, and GBP2 wild-type cells are termed NC group.
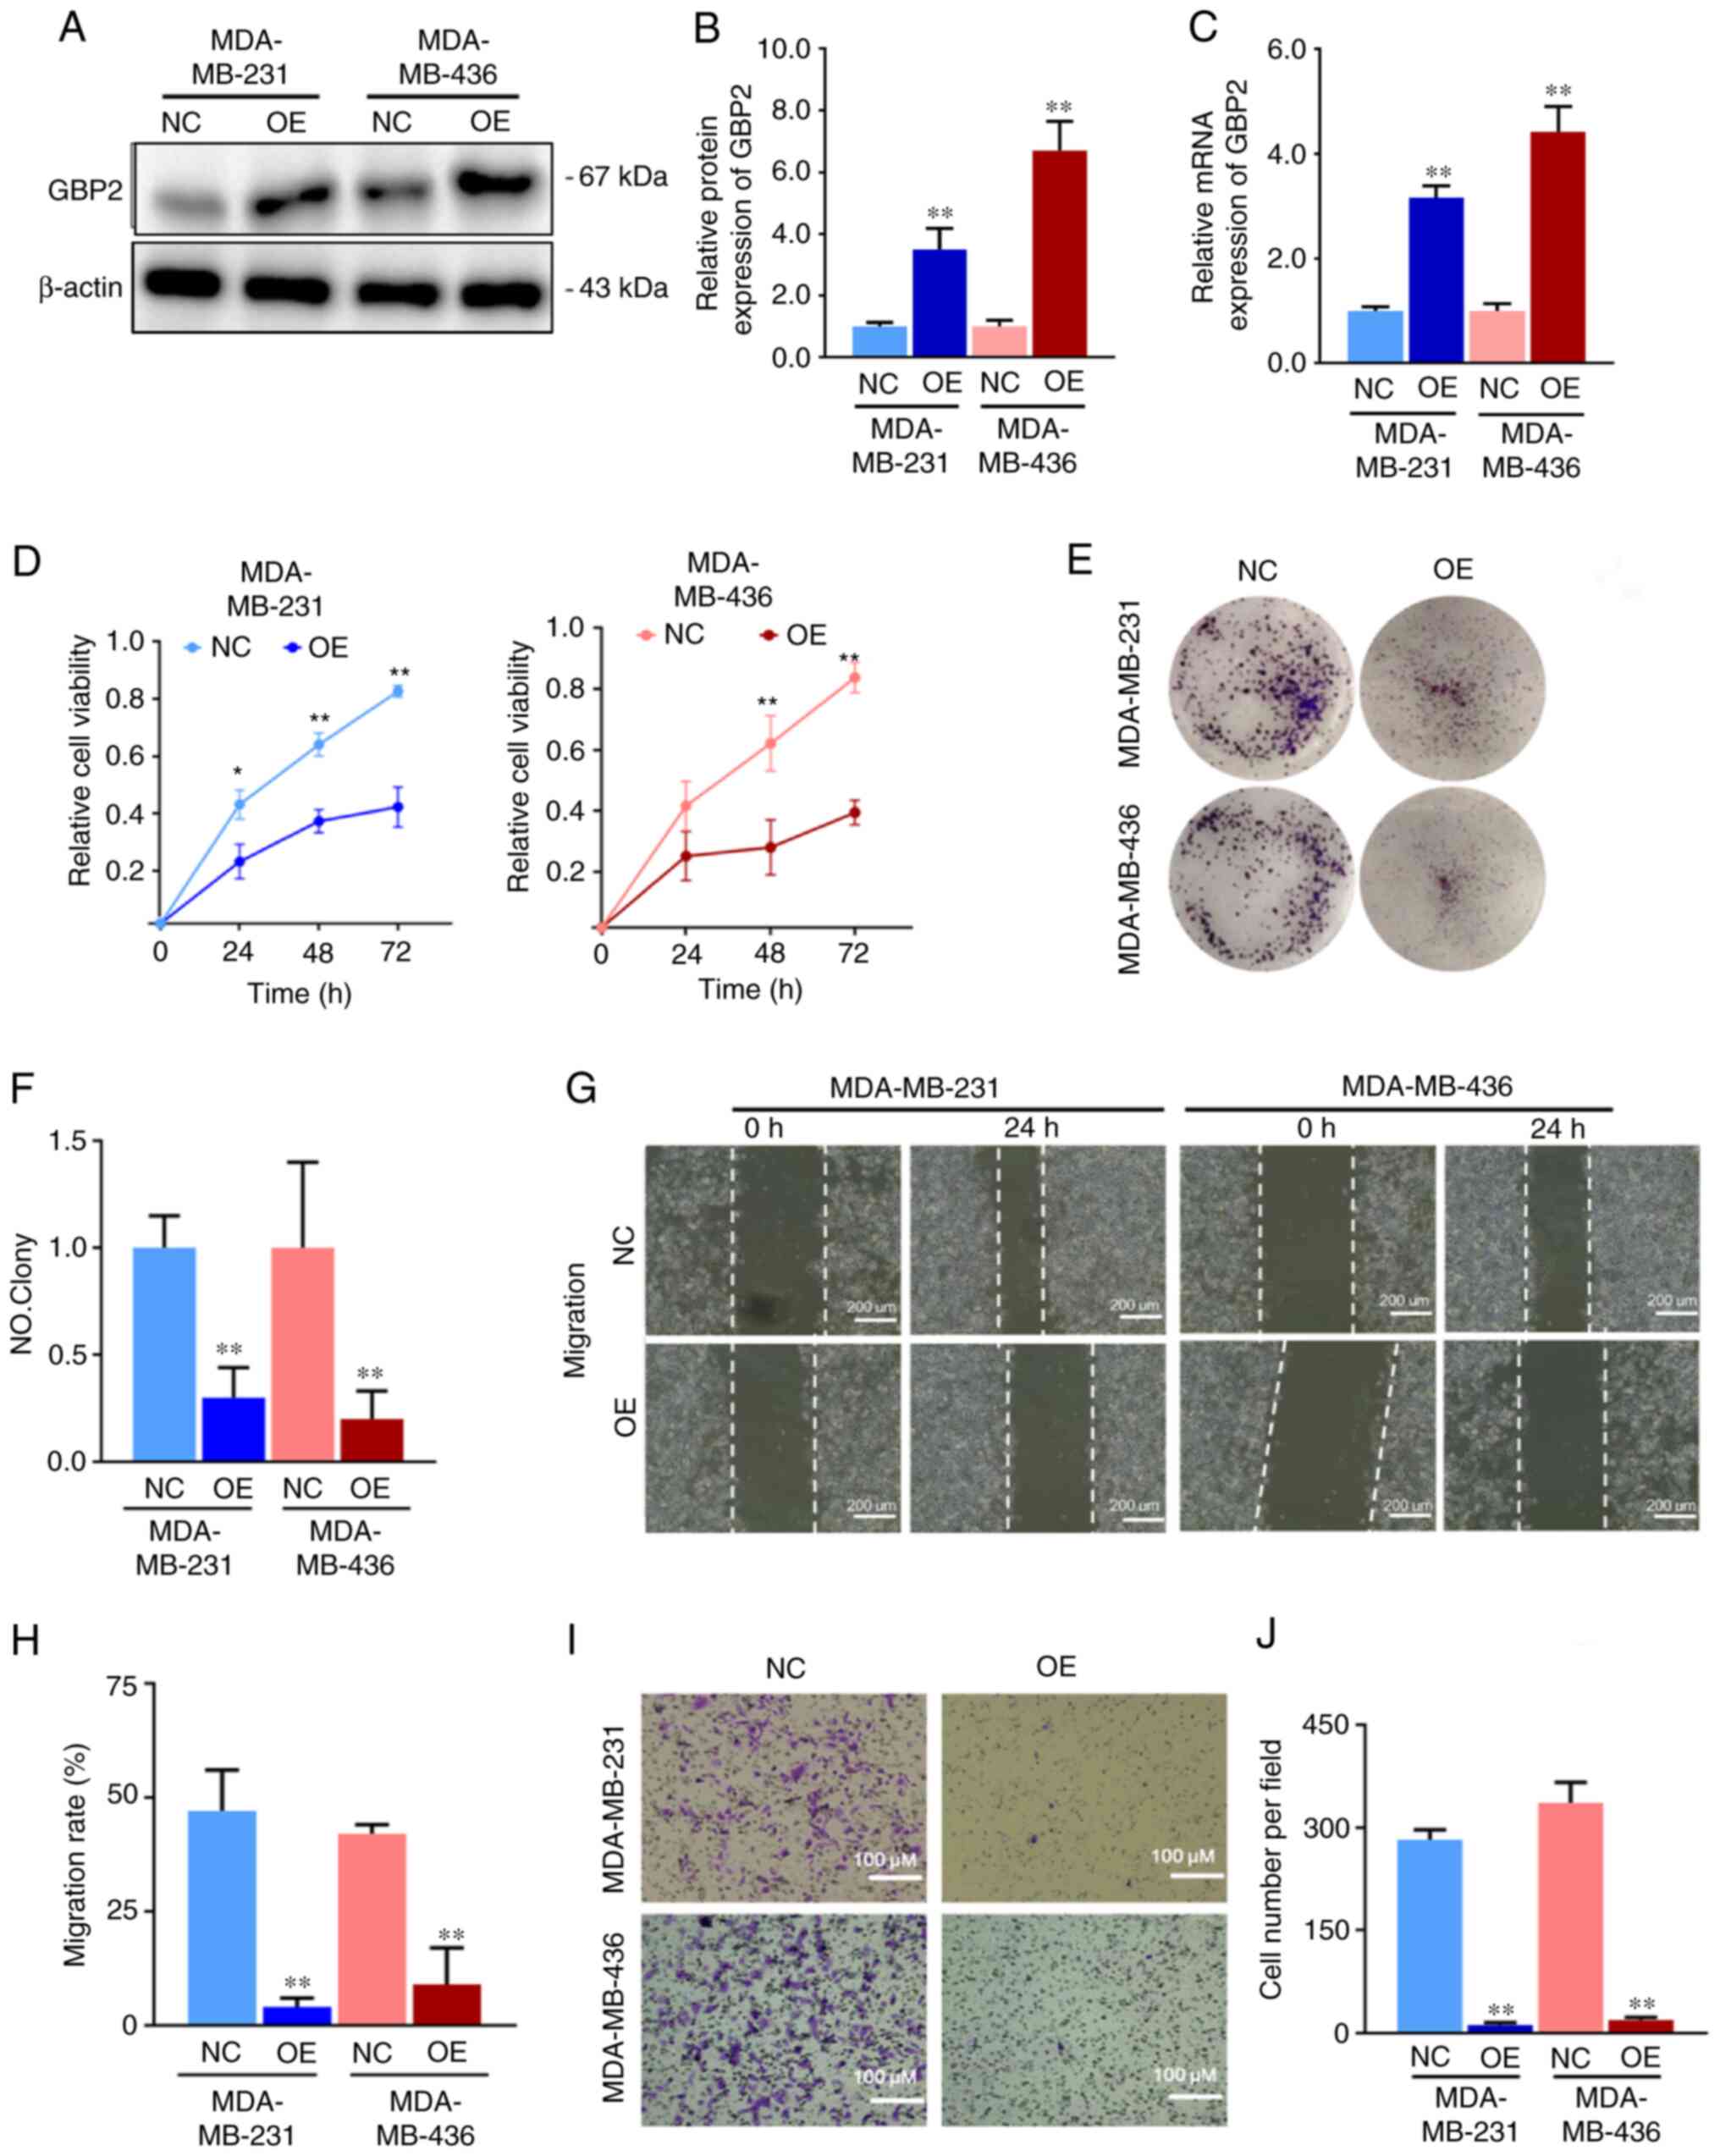
The effect of GBP2 on cell viability and proliferation was evaluated using the CCK-8 (Fig. 2D) and colony formation assays (Fig. 2E and F). Based on the outcomes, the proliferation of MDA-MB-231 cells was significantly decreased 24 h after inoculation, and the proliferation of MDA-MB-436 cells significantly decreased 48 h after inoculation following the overexpression of GBP2. In addition, colony formation experiments were performed to further examine the proliferation of MDA-MB-231 and MDA-MB-436 cells after GBP2 overexpression, especially in terms of clone-forming ability, which is closely related to the ability of the cells to generate metastasis. MDA-MB-231-OE and MDA-MB-436-OE cells generated significantly fewer colonies compared with NC, suggesting a significant role of GBP2 in inhibiting the proliferation and clone-forming ability of TNBC cells.
Migration and invasion are the key cellular events involved in tumor progression. The migration of TNBC cells after GBP2 overexpression was first examined using the gap closure assay (Fig. 2G and H). The results indicated that the migration rate of MDA-MB-231 or MDA-MB-436 cells overexpressing GBP2 at 24 h was significantly lower than that of the control cells, revealing that GBP2 conducted a significant function in the inhibition of TNBC cell migration. Cancer cells cross the basement membrane when they invade the lymphatic or vascular bed to spread. To investigate whether GBP2 is crucial in the invasion of TNBC cells, the number of invasive cells migrating through the precoated Matrigel on the upper side of the pore filters was measured using invasion chambers in Transwell experiments. Similar to what the cell migration test revealed in findings, the invasion rates of MDA-MB-231 and MDA-MB-436 cells overexpressing GBP2 were significantly lower than those of their respective control tumor cells (Fig. 2I and J), suggesting that GBP2 can significantly reduce the invasive potential of TNBC cells and inhibit their progression of tumor cells.
Analysis of the malignant behavior of MDA-MB-231 and MDA-MB-436 TNBC cells identified that the proliferation, migration and invasion of TNBC cells in vitro were significantly reduced after GBP2 overexpression, indicating that GBP2 serves a crucial role in preventing the progression of TNBC cancer.
Establishing and validated PTX-resistant TNBC cell lines
PTX is the most commonly employed chemotherapeutic agent in the clinical management of TNBC. To explore whether GBP2 affects the sensitivity of PTX, MDA-MB-231 and MDA-MB-436 cells were initially treated with various PTX concentrations (5, 10 and 15 nM) for 24 h, and the expression levels of GBP2 protein were detected by WB. In MDA-MB-231 and MDA-MB-436 cells, GBP2 protein levels increased with increasing PTX concentrations, with significant differences starting at 10 nM (Fig. 3A and B). This revealed that GBP2 protein levels were positively associated with PTX drug concentration, suggesting that GBP2 may play a synergistic role with PTX in exerting cytotoxicity, and indicated that GBP2 likely affects PTX drug sensitivity.
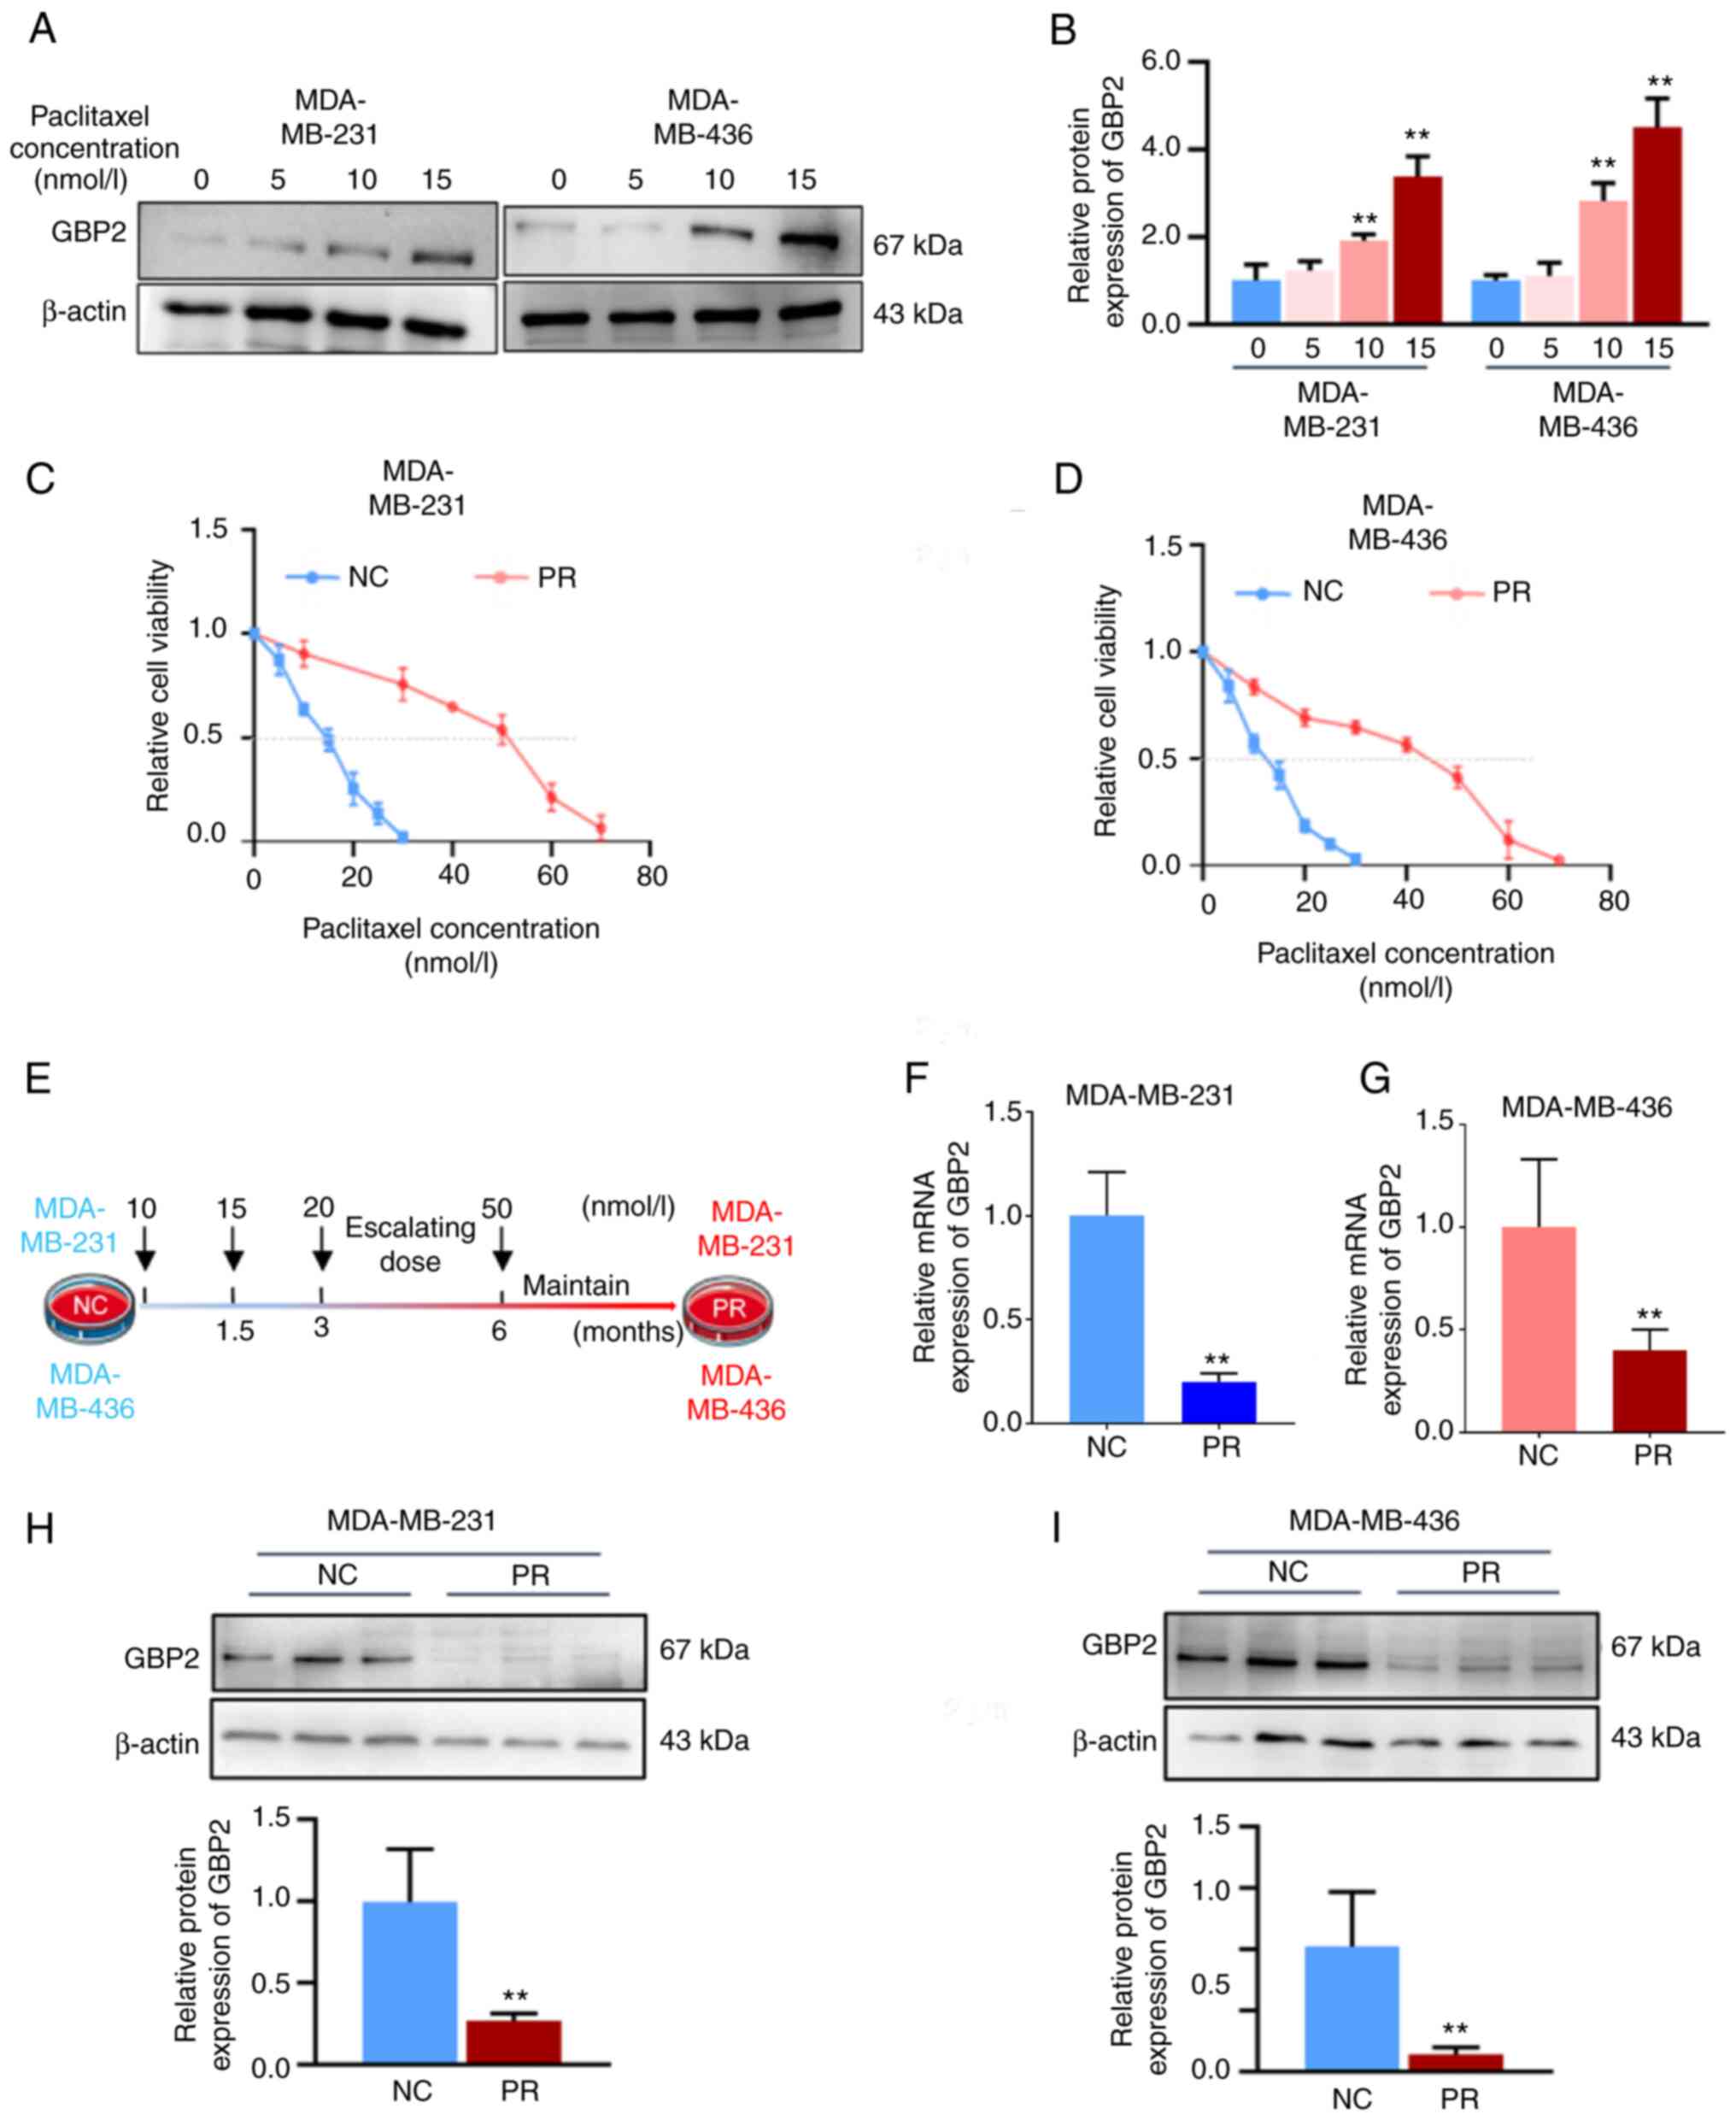
Subsequently, the PTX-resistant MDA-MB-231 and MDA-MB-436 cell lines were established. Various PTX concentrations were applied to the cell lines for 24 h; CCK-8 assay was used to assess the IC50 values of PTX in MDA-MB-231-NC and MDA-MB-436-NC, and the results were 14.9 and 12.5 nM, respectively (Fig. 3C and D). Subsequently, the concentration of PTX was started at 10 nM, and the MDA-MB-231 and MDA-MB-436 cells were provided with PTX treatments at higher concentrations once the cells were acclimated for 6 months, after which the concentration of PTX was maintained at 50 nM, and the cells proliferated stably (Fig. 3E). The cell viability assay data suggested that the IC50 values of the domesticated treated cells (referred to as PR group) became significantly higher (51.5 nM in MDA-MB-231-PR, 42.4 nM in MDA-MB-436-PR) (Fig. 3D and E), proving that PTX-resistant cell lines were successfully established in TNBC.
Overexpression of GBP2 reverses PTX resistance in TNBC
First, RT-qPCR and WB assays were utilized to detect mRNA and protein levels of GBP2 in wild-type (NC group) and PTX-resistant (PR group) MDA-MB-231 and MDA-MB-436 cells, respectively, and it was revealed that both PTX-resistant strains had significantly lower GBP2 expression (Fig. 3F-I).
Subsequently, the primary experimental target consisted of PTX-resistant MDA-MB-231 cells and transfected with overexpression of GBP2 adenovirus. The efficiency of viral transfection in resistant cells was examined to ensure the accuracy of subsequent experiments (Fig. S1B). WB assays (Fig. 4A and B) and RT-qPCR experiments (Fig. 4C) were performed on MDA-MB-231 parental cells (NC), PTX-resistant cells (PR), and resistant + transfected cells overexpressing GBP2 (PR + OE); the mRNA level of GBP2 in PR was found to be substantially lower than that of NC, and after adenoviral transfection, the mRNA level of GBP2 rebounded significantly; the situation of GBP2 protein expression level was similar to that of mRNA, confirming the successful overexpression of GBP2 in PTX-resistant MDA-MB-231 cells.
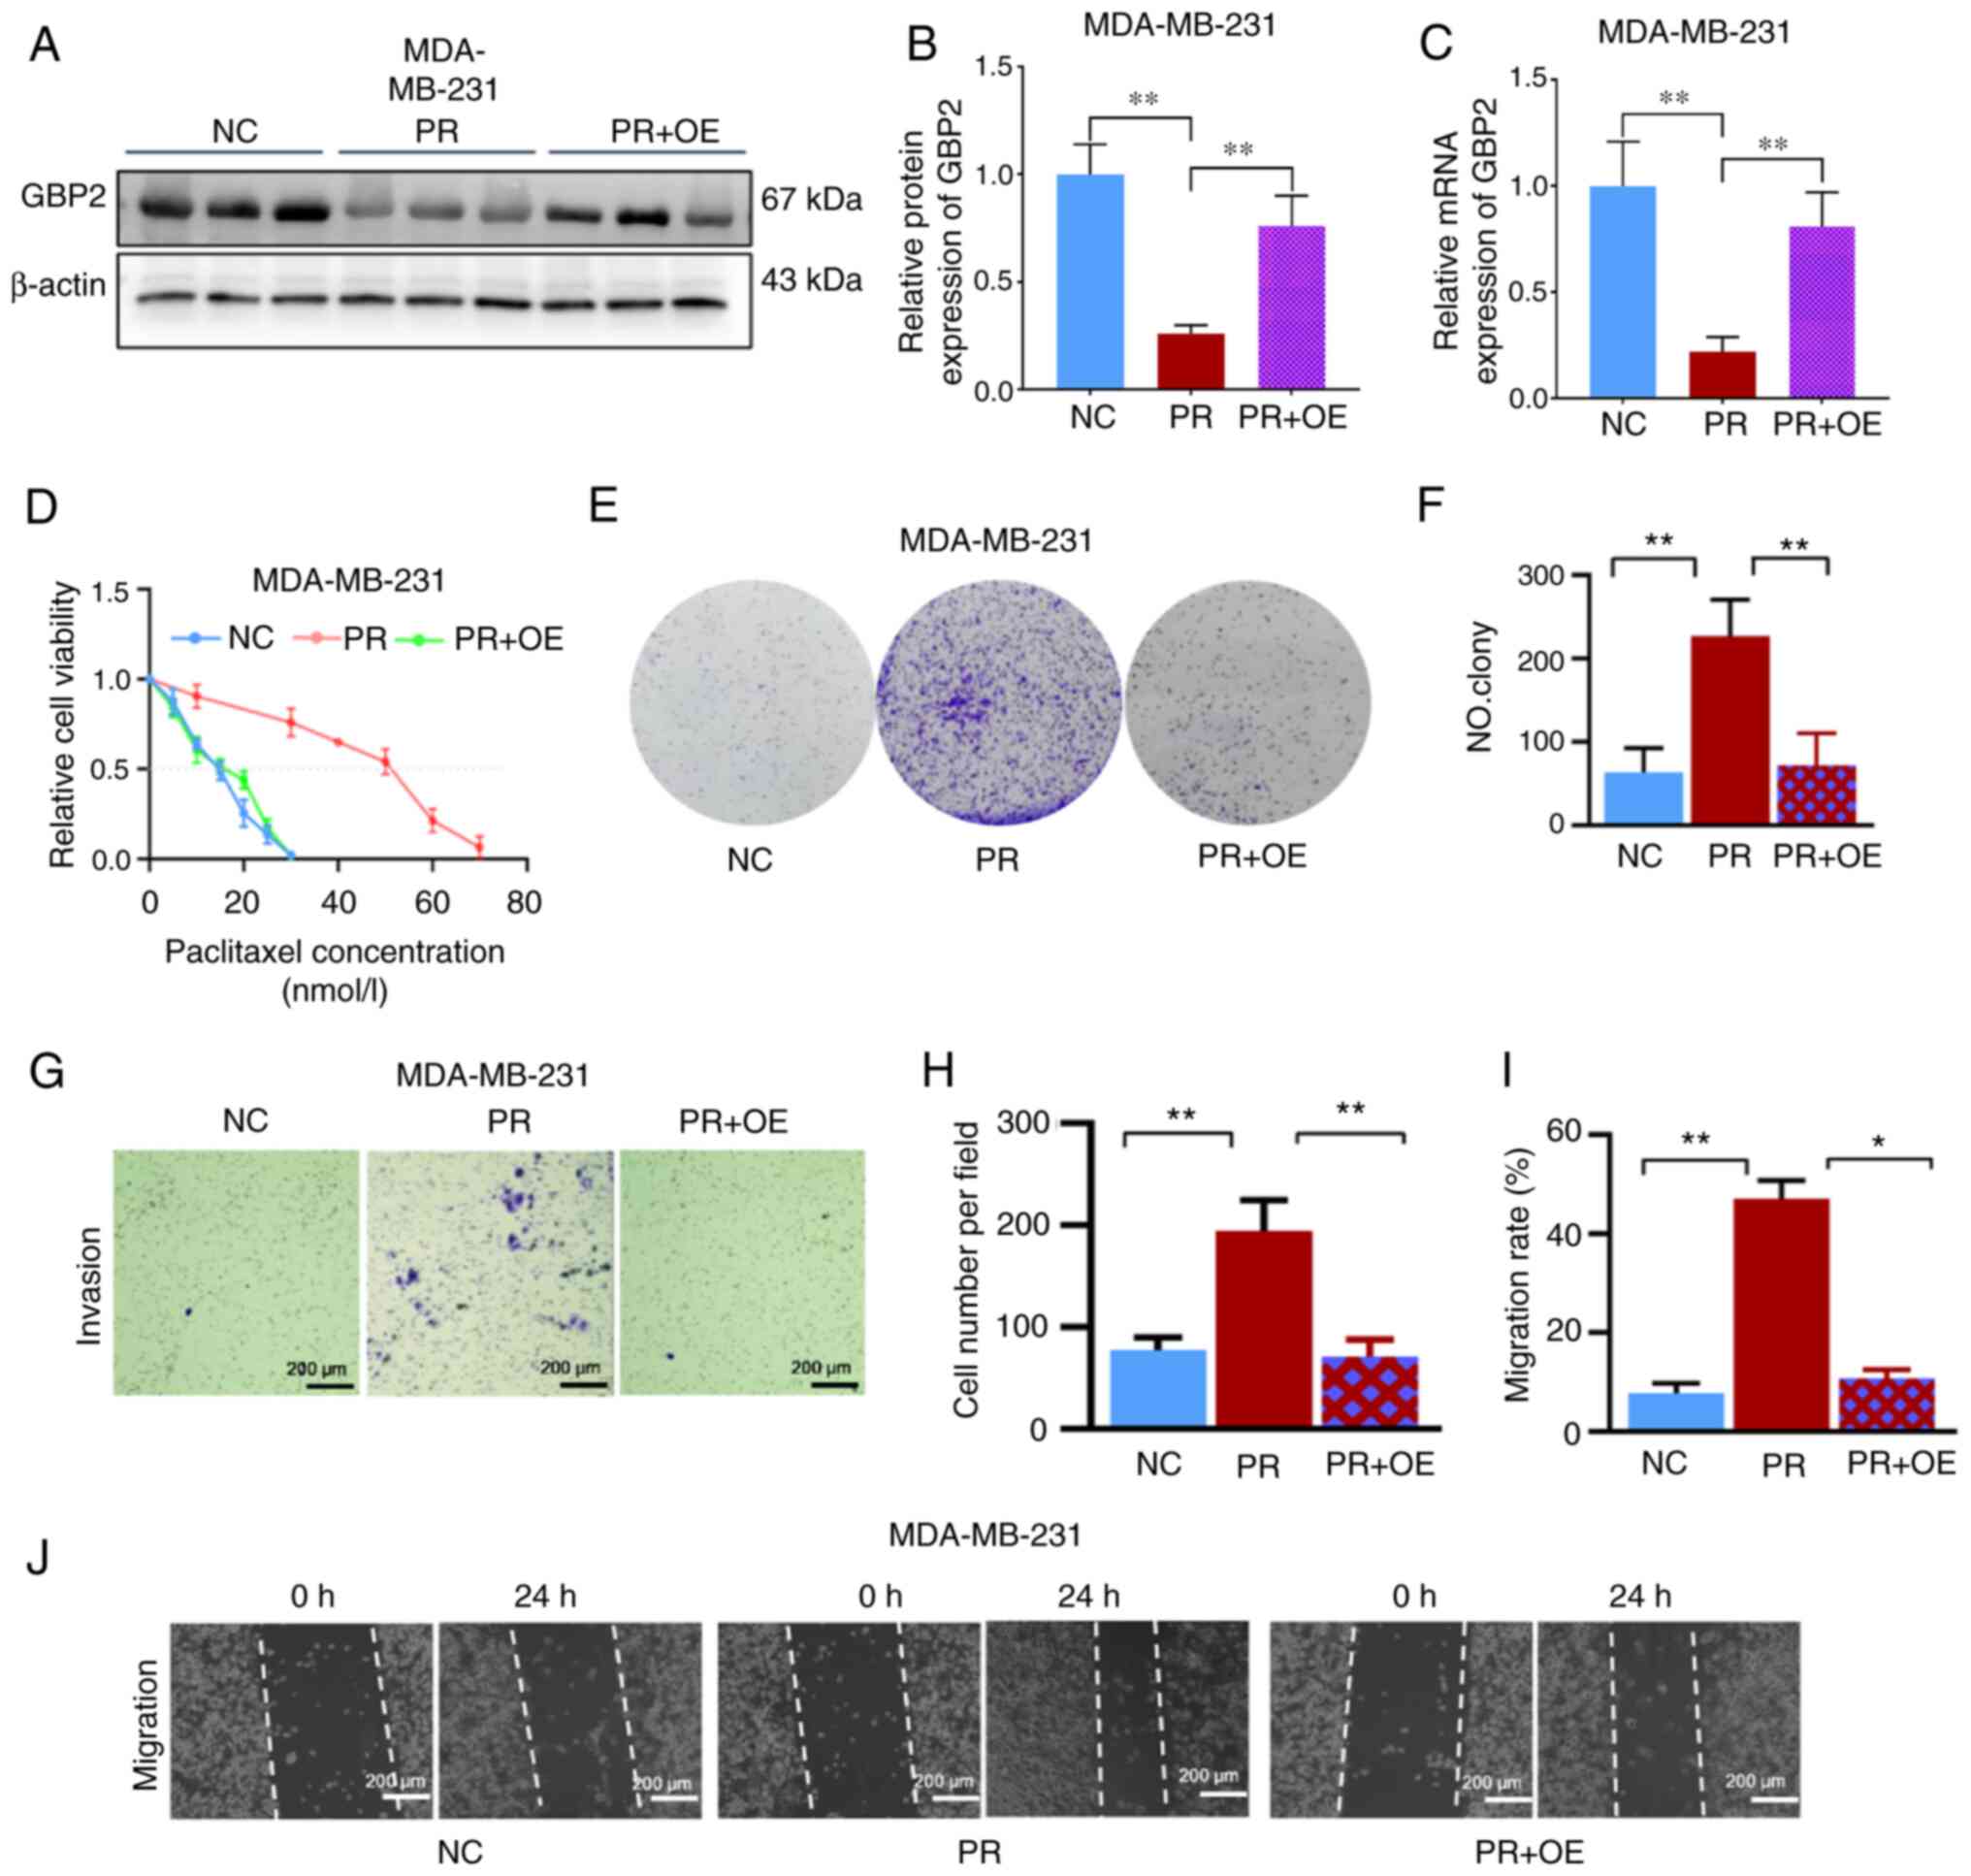
According to findings from the CCK-8 experimental cell viability assay, the PR + OE group's IC50 value (15.0 nM) was significantly lower than the PR group's value (51.5 nM) (Fig. 4D), indicating that GBP2 overexpression significantly enhanced the PTX sensitivity of MDA-MB-231 cells. To further illustrate this, colony formation experiments were performed, which revealed that PR cells produced significantly more colonies than the NC group (P<0.01); whereas, after GBP2 overexpression (PR + OE), cells had significantly fewer colonies compared with PR (P<0.01) (Fig. 4E and F). The Transwell assay was used to measure the number of migratory cells in each of the three groups; the PR group had a significantly higher number of cells per unit area compared with the NC group (P<0.01), and substantially lower in the PR + OE group than in the PR group (P<0.01) (Fig. 4G and H). Finally, the migration of cells in the three groups was examined using the gap closure assay; considering the images and the calculated migration rates, it was determined that cells in the PR group had a markedly greater capacity for invasion than those in the NC group, while the invasive ability of the drug-resistant cell line with GBP2 overexpression was substantially reduced in the PR + OE group compared with the PR group (P<0.05) (Fig. 4I and J).
In conclusion, it was demonstrated that PTX-resistant TNBC cells had considerably lower levels of GBP2 expression, and the resistance to PTX was reversed after the overexpression of GBP2 by adenoviral transfection. Additionally, the outcomes revealed that PTX-resistant cells' viability was considerably decreased when GBP2 was overexpressed, which renders PTX more toxic to drug-resistant TNBC cells and is crucial in reversing PTX resistance in TNBC.
Overexpression of GBP2 activates autophagy in TNBC
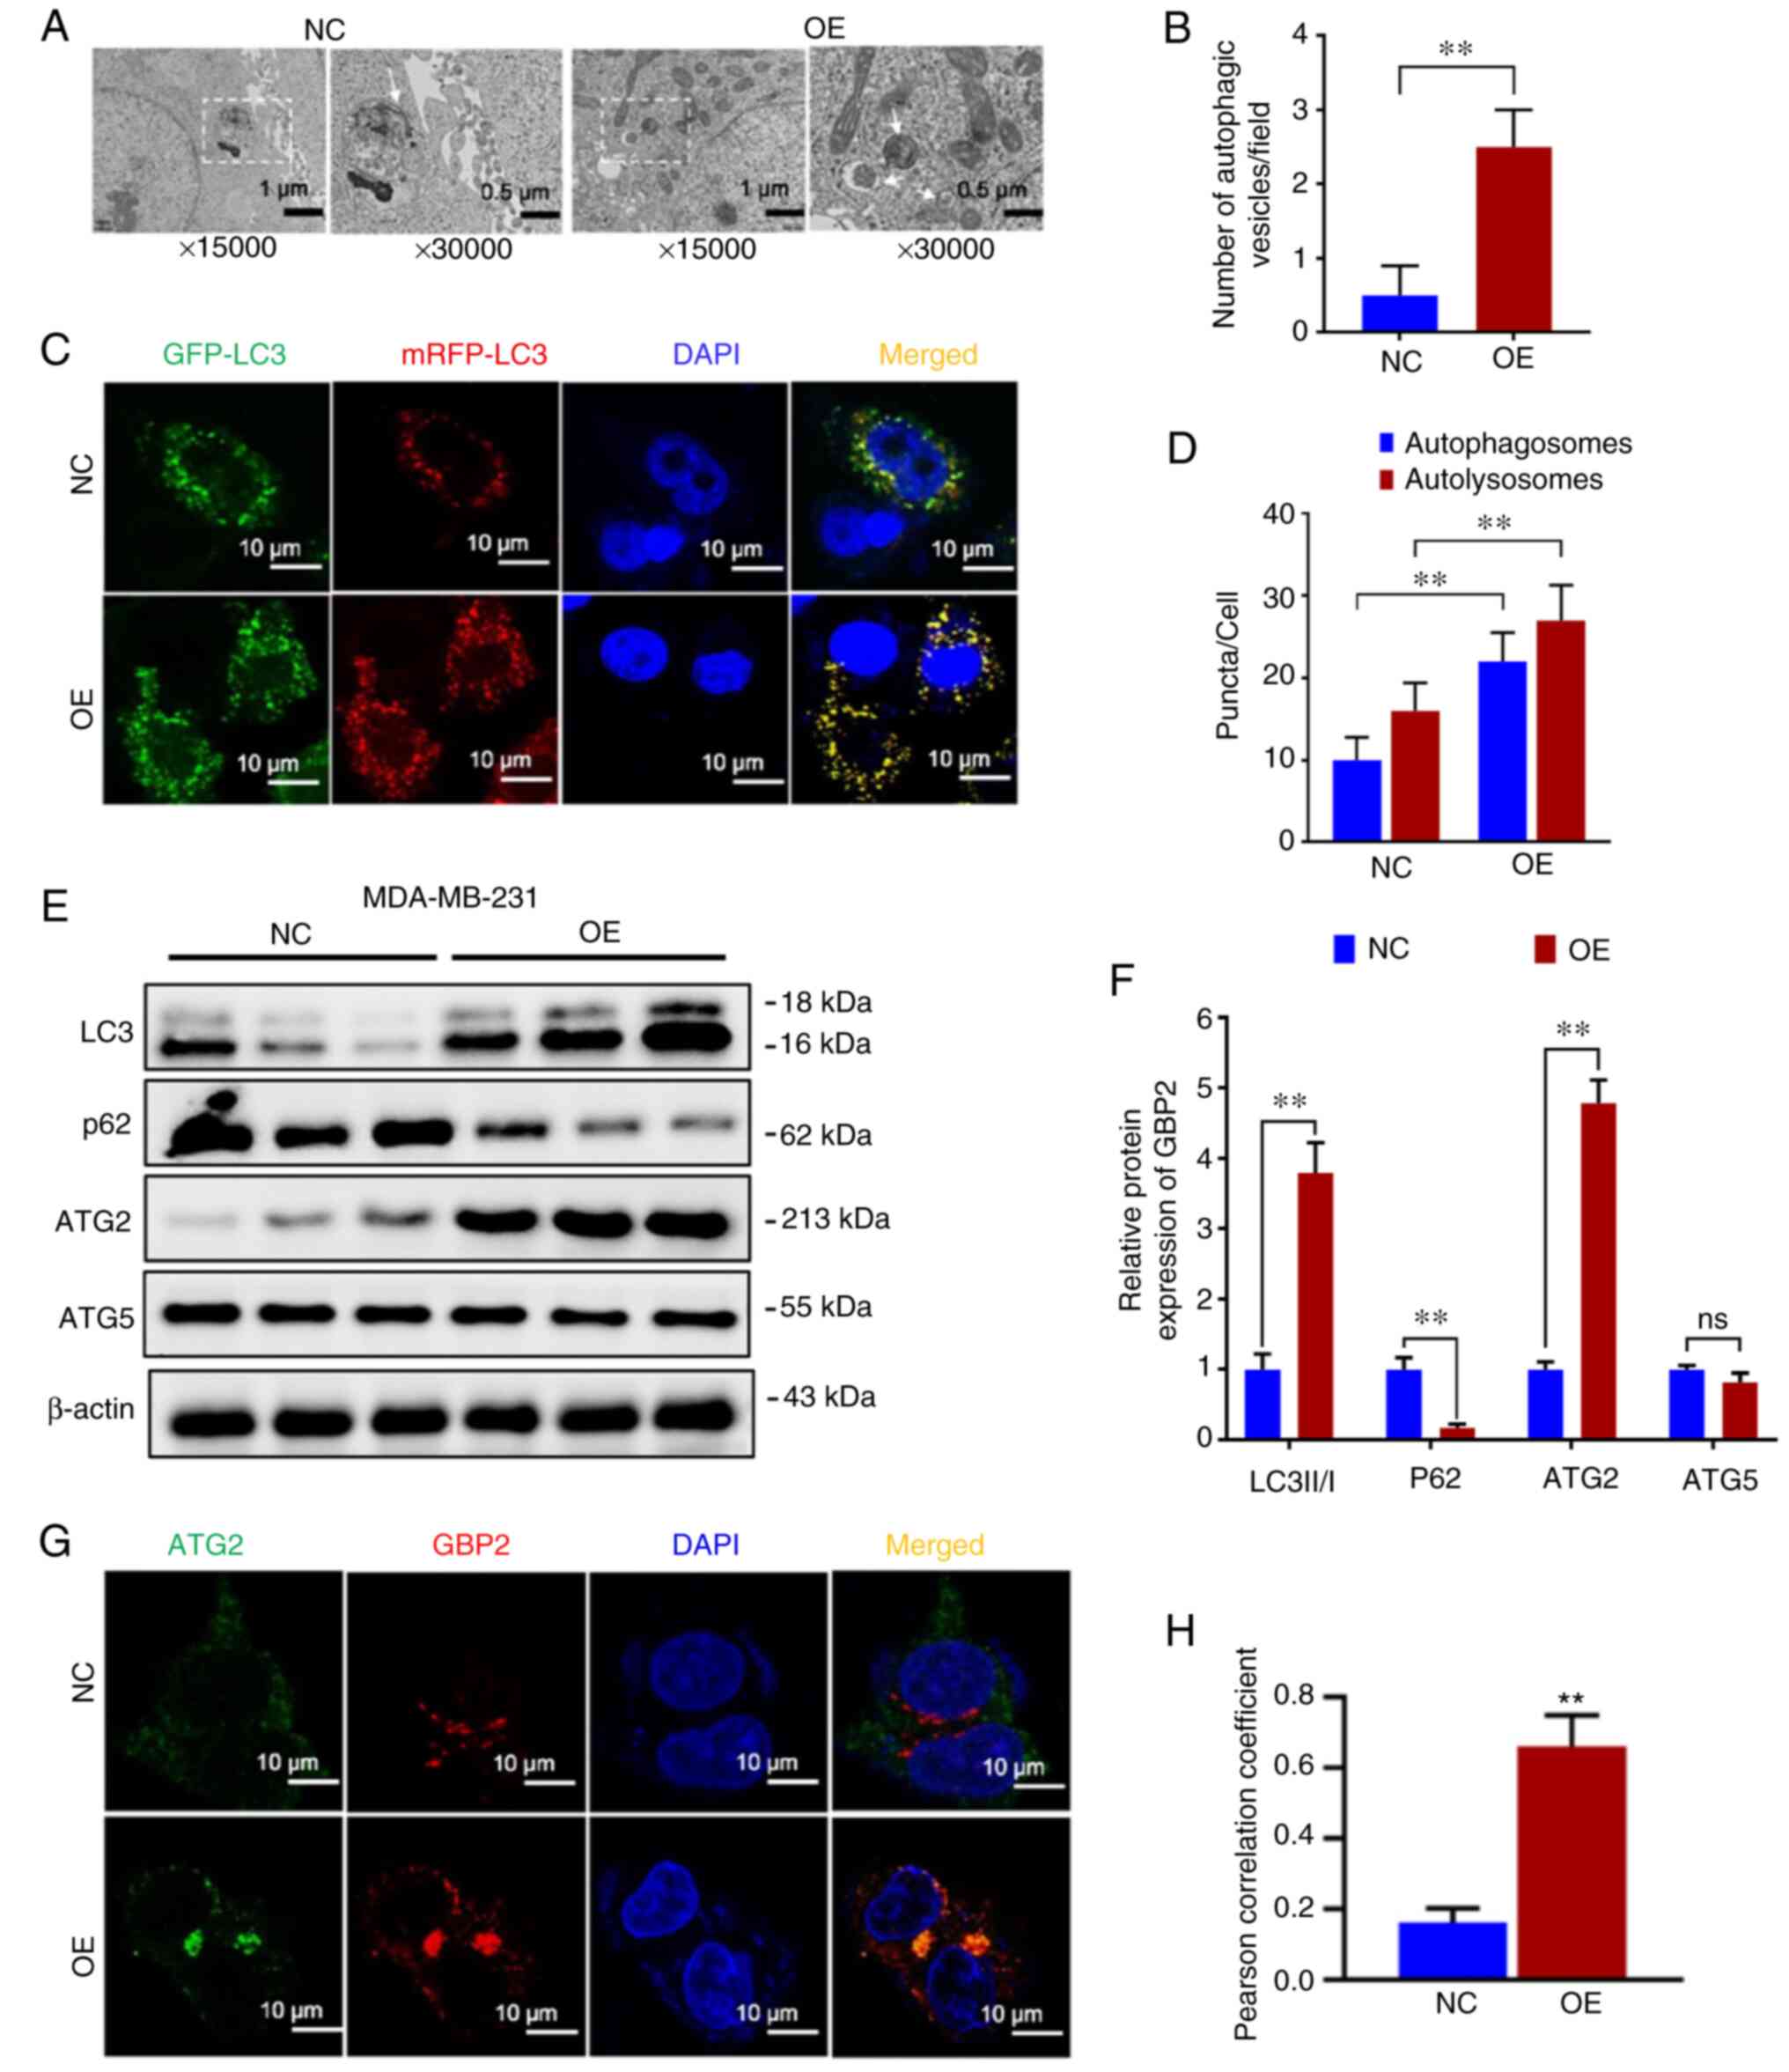
Because drug resistance is often closely related to autophagy, the difference in autophagy between parental cells (NC) and GBP2 overexpressing (OE) MDA-MB-231 cells was examined. First, cell crawls were made, and autophagic vesicles were observed under electron microscopy. Compared with the NC group, the OE group was demonstrated to have more autophagic vesicles per unit field of view (Fig. 5A and B), suggesting enhanced autophagy in the OE group. To further confirm this, the expression of LC3 was racked by infecting with GFP-mRFP-LC3 double-labeled virus, and it was observed that the level of red fluorescence showed a significant increase in the OE group compared with the NC group, and yellow fluorescence was significantly increased following merging (Fig. 5C), suggesting that autophagy lysosomes and autophagosomes were increased, which were quantified as demonstrated in the histogram (P<0.01) (Fig. 5D). Based on the results, it was observed that the autophagic flux was significantly higher in the OE group compared with the NC group, indicating that GBP2 overexpression promoted autophagy in MDA-MB-231 cells. Finally, WB was used to compare the autophagy-related proteins of the two groups of cells. It was revealed that LC3 II/I ratio of the OE group was significantly higher than the NC group, while P62 was significantly lower (Fig. 5E and F), indicating that GBP2 overexpression enhanced cellular autophagy.
GBP2 enhances autophagy by inhibiting the PI3K/AKT/mTOR pathway and acting in combination with ATG2
To explore the mechanism underlying autophagy activation by GBP2 overexpression, an examination of autophagy-related proteins was conducted. Among the ATG family proteins closely related to autophagy, ATG5 was not significantly altered; however, ATG2 was significantly elevated in the OE group (Fig. 5E and F), suggesting that there may be a specific synergistic effect of GBP2 and ATG2 in autophagy. Subsequently, GBP2 and ATG2 were fluorescently labeled by immunofluorescence co-localization and it was observed that both demonstrated significantly increased expression in the OE group, with highly consistent localization (Fig. 5G). The Pearson's correlation coefficient was calculated using ImageJ with the collection of fluorescent spots expression and localization data; the OE group demonstrated a significant increase (P<0.01) (Fig. 5H), suggesting that GBP2 and ATG2 interacted and jointly enhanced autophagy.
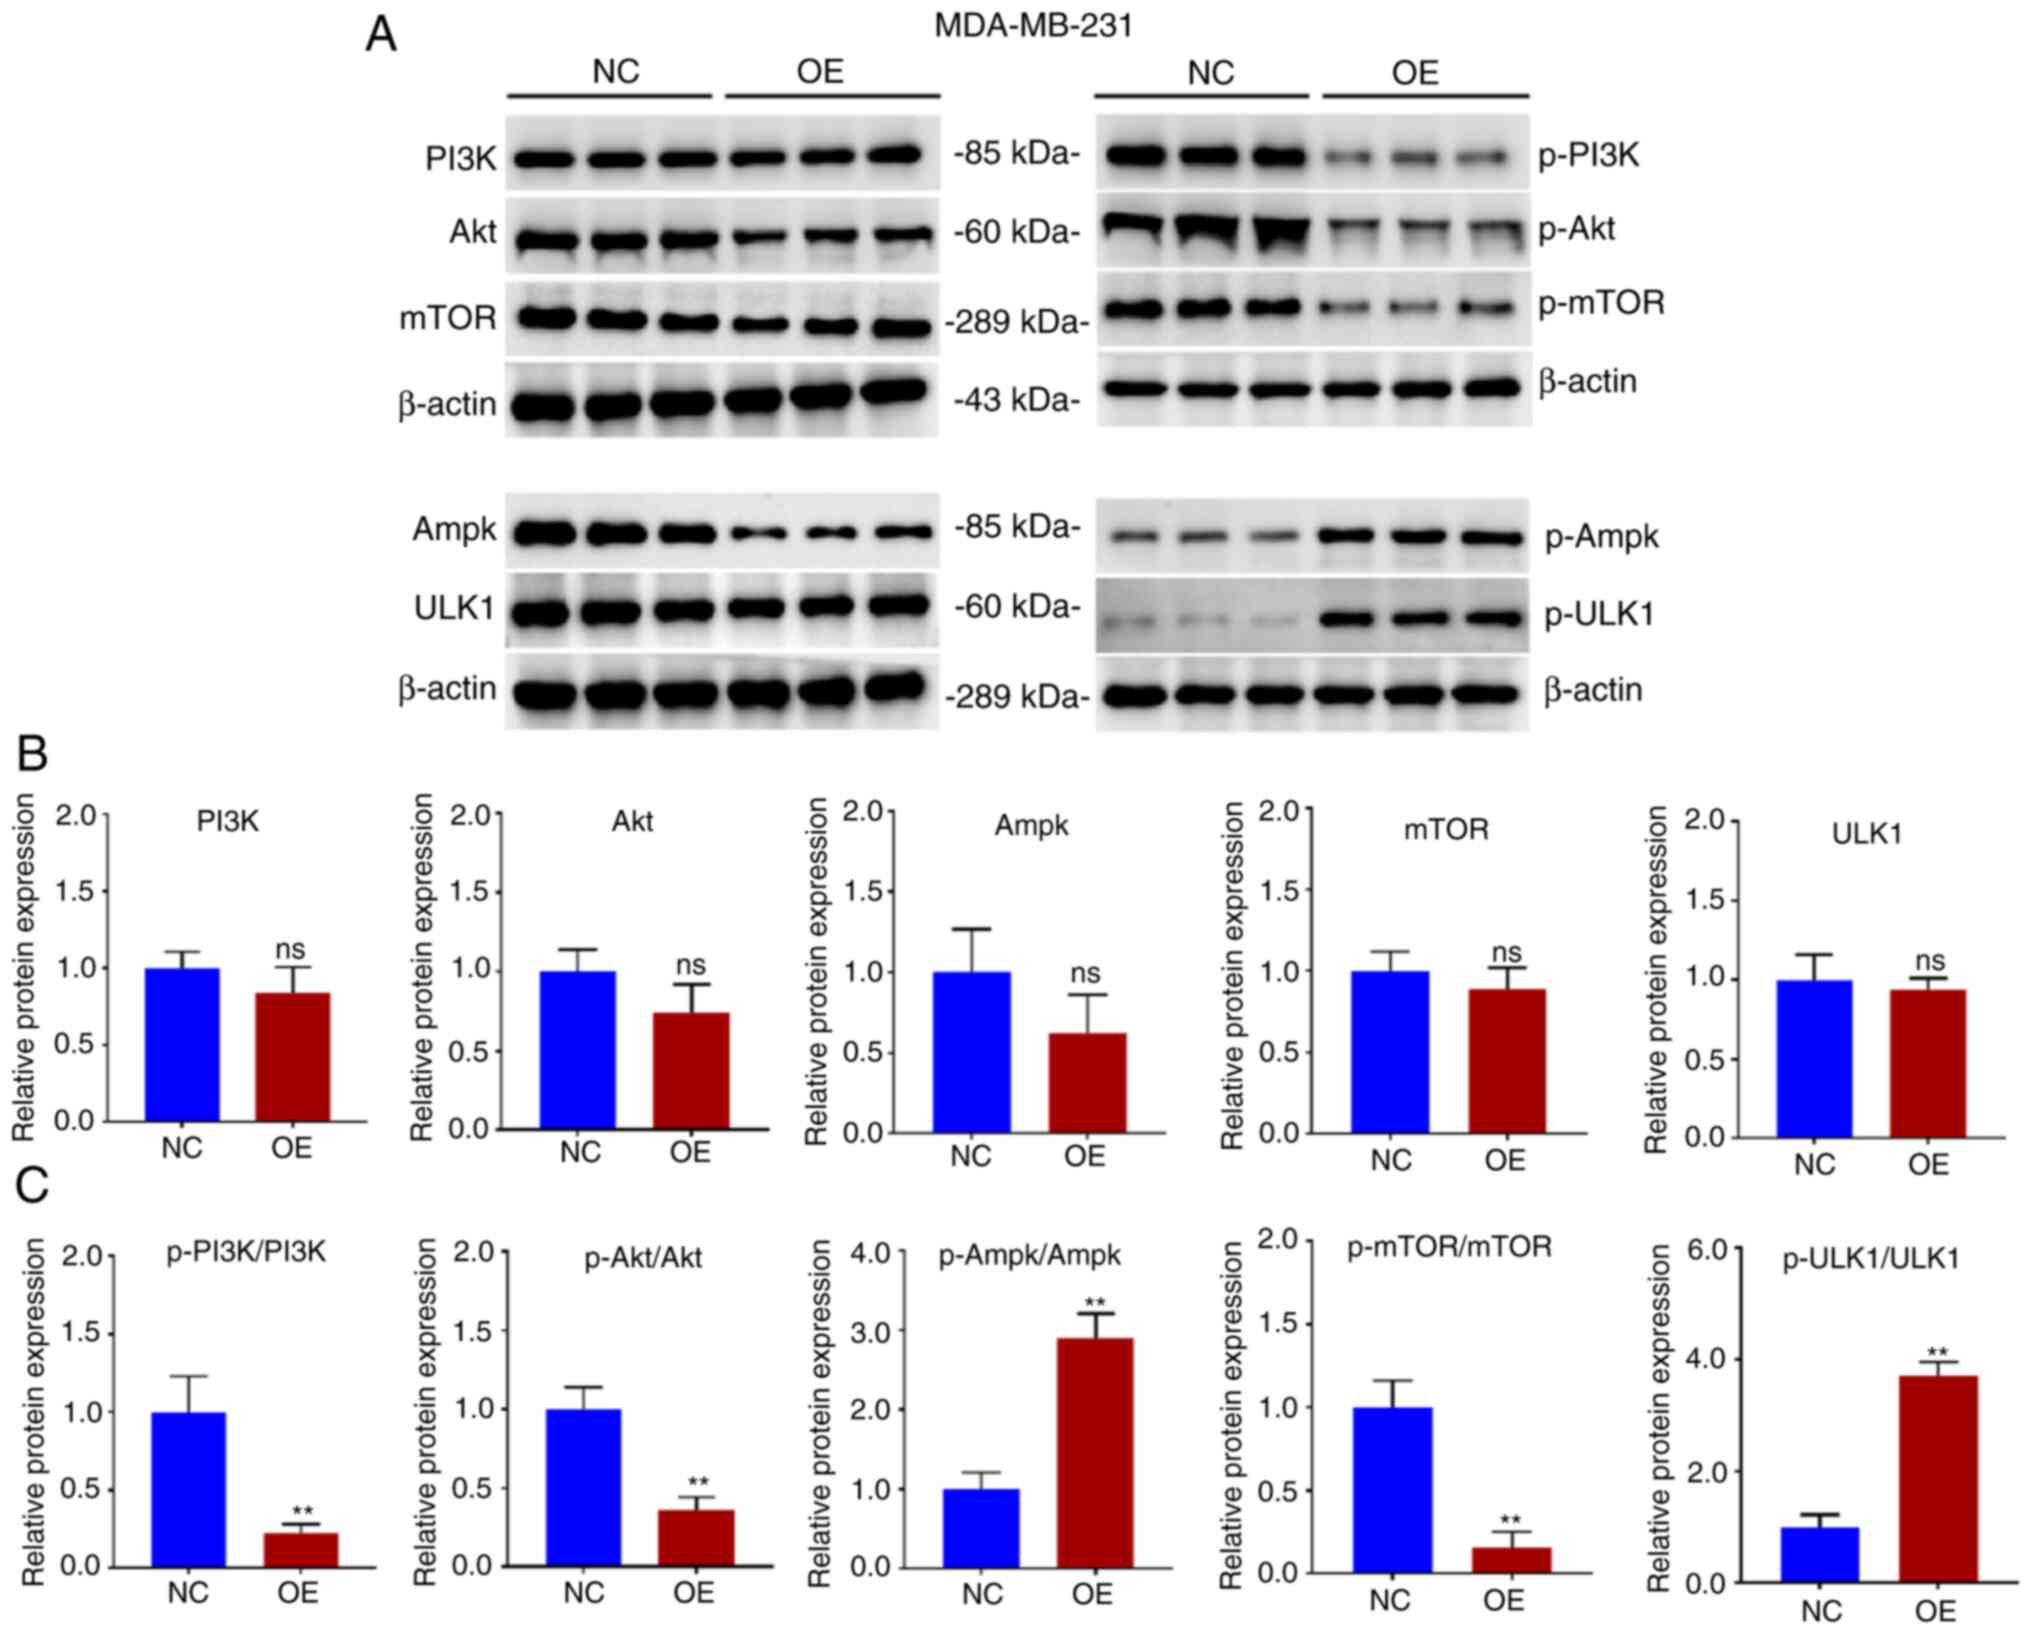
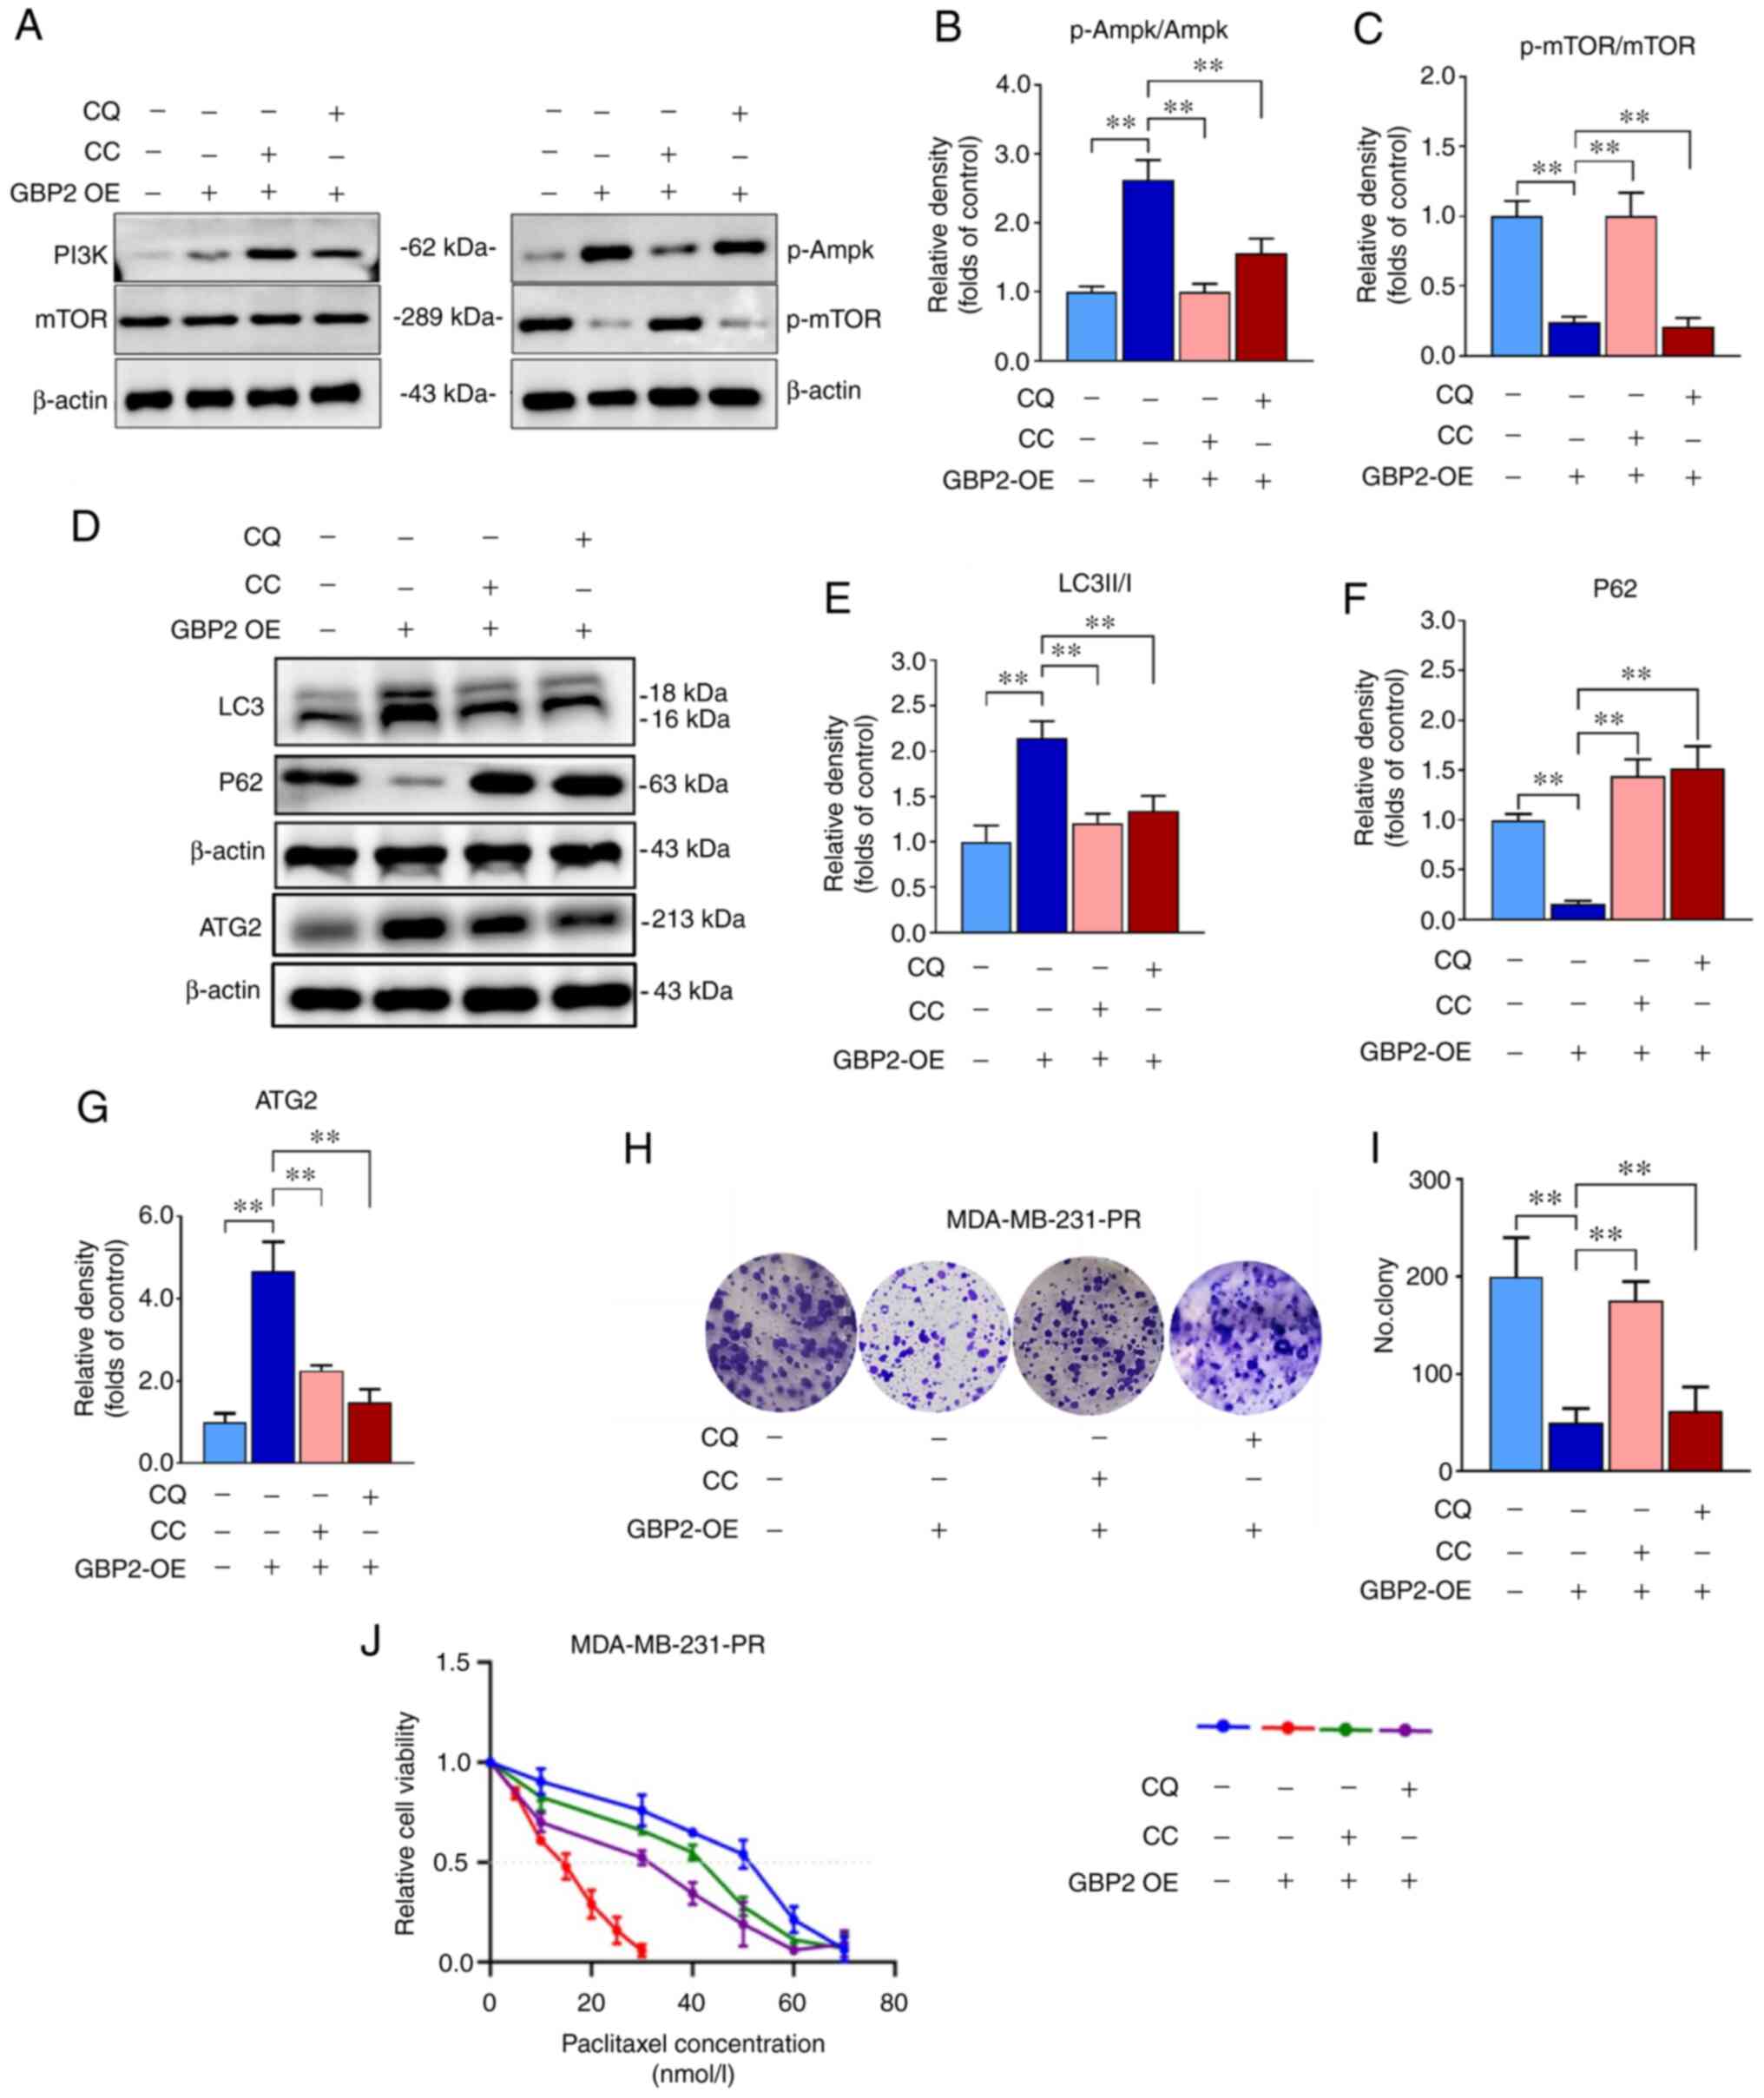
PI3K/AKT/mTOR is a primary pathway affecting autophagy, and whether the overexpression of GBP2 affected autophagy was further explored. Proteins were extracted from MDA-MB-231 parental cells (NC) and GBP2 overexpression stable transgenic cells (OE) and WB experiments were performed (Fig. 6A). It was revealed that the overall protein levels of PI3K/AKT/mTOR did not exhibit significant differences between the group OE and NC (Fig. 6B), whereas the group that revealed overexpression (OE) exhibited a notable decrease in the levels of phosphorylated (p-) PI3K, AKT and mTOR (P<0.01) (Fig. 6C), suggesting that GBP2 overexpression significantly suppressed the PI3K/AKT/mTOR pathway's activity. Ampk, an upstream protein of mTOR, inhibits mTOR, and ULK1, a downstream target of mTOR, is repressed by mTOR. The results of WB identified that there was an increase in the phosphorylation proportions of p-Ampk/Ampk and p-ULK1/ULK1, consistent with previous results. CC is an Ampk inhibitor that activates downstream mTOR signaling. The treatment of CC in MDA-MB-231 cells with GBP2-OE decreased LC3-II and p-Ampk, while increased p62 and p-mTOR levels (Fig. 7A-F), suggesting that reactivation of PI3K/AKT/mTOR after GBP2 overexpression leads to the inhibition of autophagy. Based on the results, it can be inferred that GBP2 plays a crucial role in regulating autophagy by suppressing PI3K/AKT/mTOR signaling.
Enhanced autophagy by GBP2 leads to reversal of PTX resistance in TNBC cells
CQ, a classic autophagy inhibitor, prevents autophagosomal fusion and degradation; this effect of CQ was applied in MDA-MB-231-PR cells overexpressing GBP2, and the results indicated a decline in the LC3II/I ratio and an increase in P62, confirming that autophagy was inhibited (Fig. 7D-F). The expression level of ATG2 in each group was also examined and it was reconfirmed that GBP2 enhances autophagy synergistically with ATG2 (Fig. 7D and G). Additionally, colony formation experiments revealed that overexpression of GBP2 in MDA-MB-231-PR cells substantially augmented inhibition of cell viability and that CQ could mitigate this effect (Fig. 7H and I), suggesting the inhibition of autophagy while restoring cell growth viability; similar outcomes were obtained utilizing CC (Fig. 7H and I). Notably, the decrease in cell viability caused by GBP2 expression is crucial in reversing PTX resistance. These results suggested that autophagy may be related to the chemosensitivity of PTX to MDA-MB-231-PR cells.
It was investigated whether GBP2-mediated autophagy activation contributes to the reverse of drug resistance in TNBC cells. The IC50 was determined to verify the effect of various factors on the sensitivity of MDA-MB-231-PR cells to PTX using the CCK-8 assay. The results revealed that GBP2 overexpression significantly reduced the IC50 value, suggesting that the PTX sensitivity of drug-resistant cells was significantly increased, and the addition of CQ or CC caused the IC50 value to rise significantly, leading to increased resistance to PTX (Fig. 7J). These results suggested that CQ and CC inhibit autophagy activated by GBP2 overexpression, consequently increasing cellular resistance to PTX and demonstrating that autophagy activated by GBP2 leads to the reversal of PTX resistance in TNBC cells.
GBP2 overexpression suppresses the growth of TNBC tumors in vivo by inhibiting proliferation and enhancing autophagy
To confirm the oncogenic and autophagy-enhancing effects of GBP2 overexpression on TNBC in vivo, female BALB/c nude mice aged between 4-6 weeks were selected and randomly divided into control (Con) and GBP2-overexpression (OE) groups for the subcutaneous injection of MDA-MB-231 parental cells and GBP2 overexpression cells for subcutaneous tumor formation experiments (Fig. 8A). Every five days, the volume of tumors and body weight of the mice were recorded (Fig. 8B and C). There was not a substantial disparity in weight regarding the two groups, according to the results, whereas the OE group revealed significantly reduced tumor volume and growth rate. The tumor size was observed after 35 days of feeding (Fig. 8D), and the tumor weight and tumor weight/body weight ratio of the OE group were calculated to be lower (Fig. 8E and F). These results confirmed that GBP2 overexpression significantly inhibited the growth of TNBC tumors.
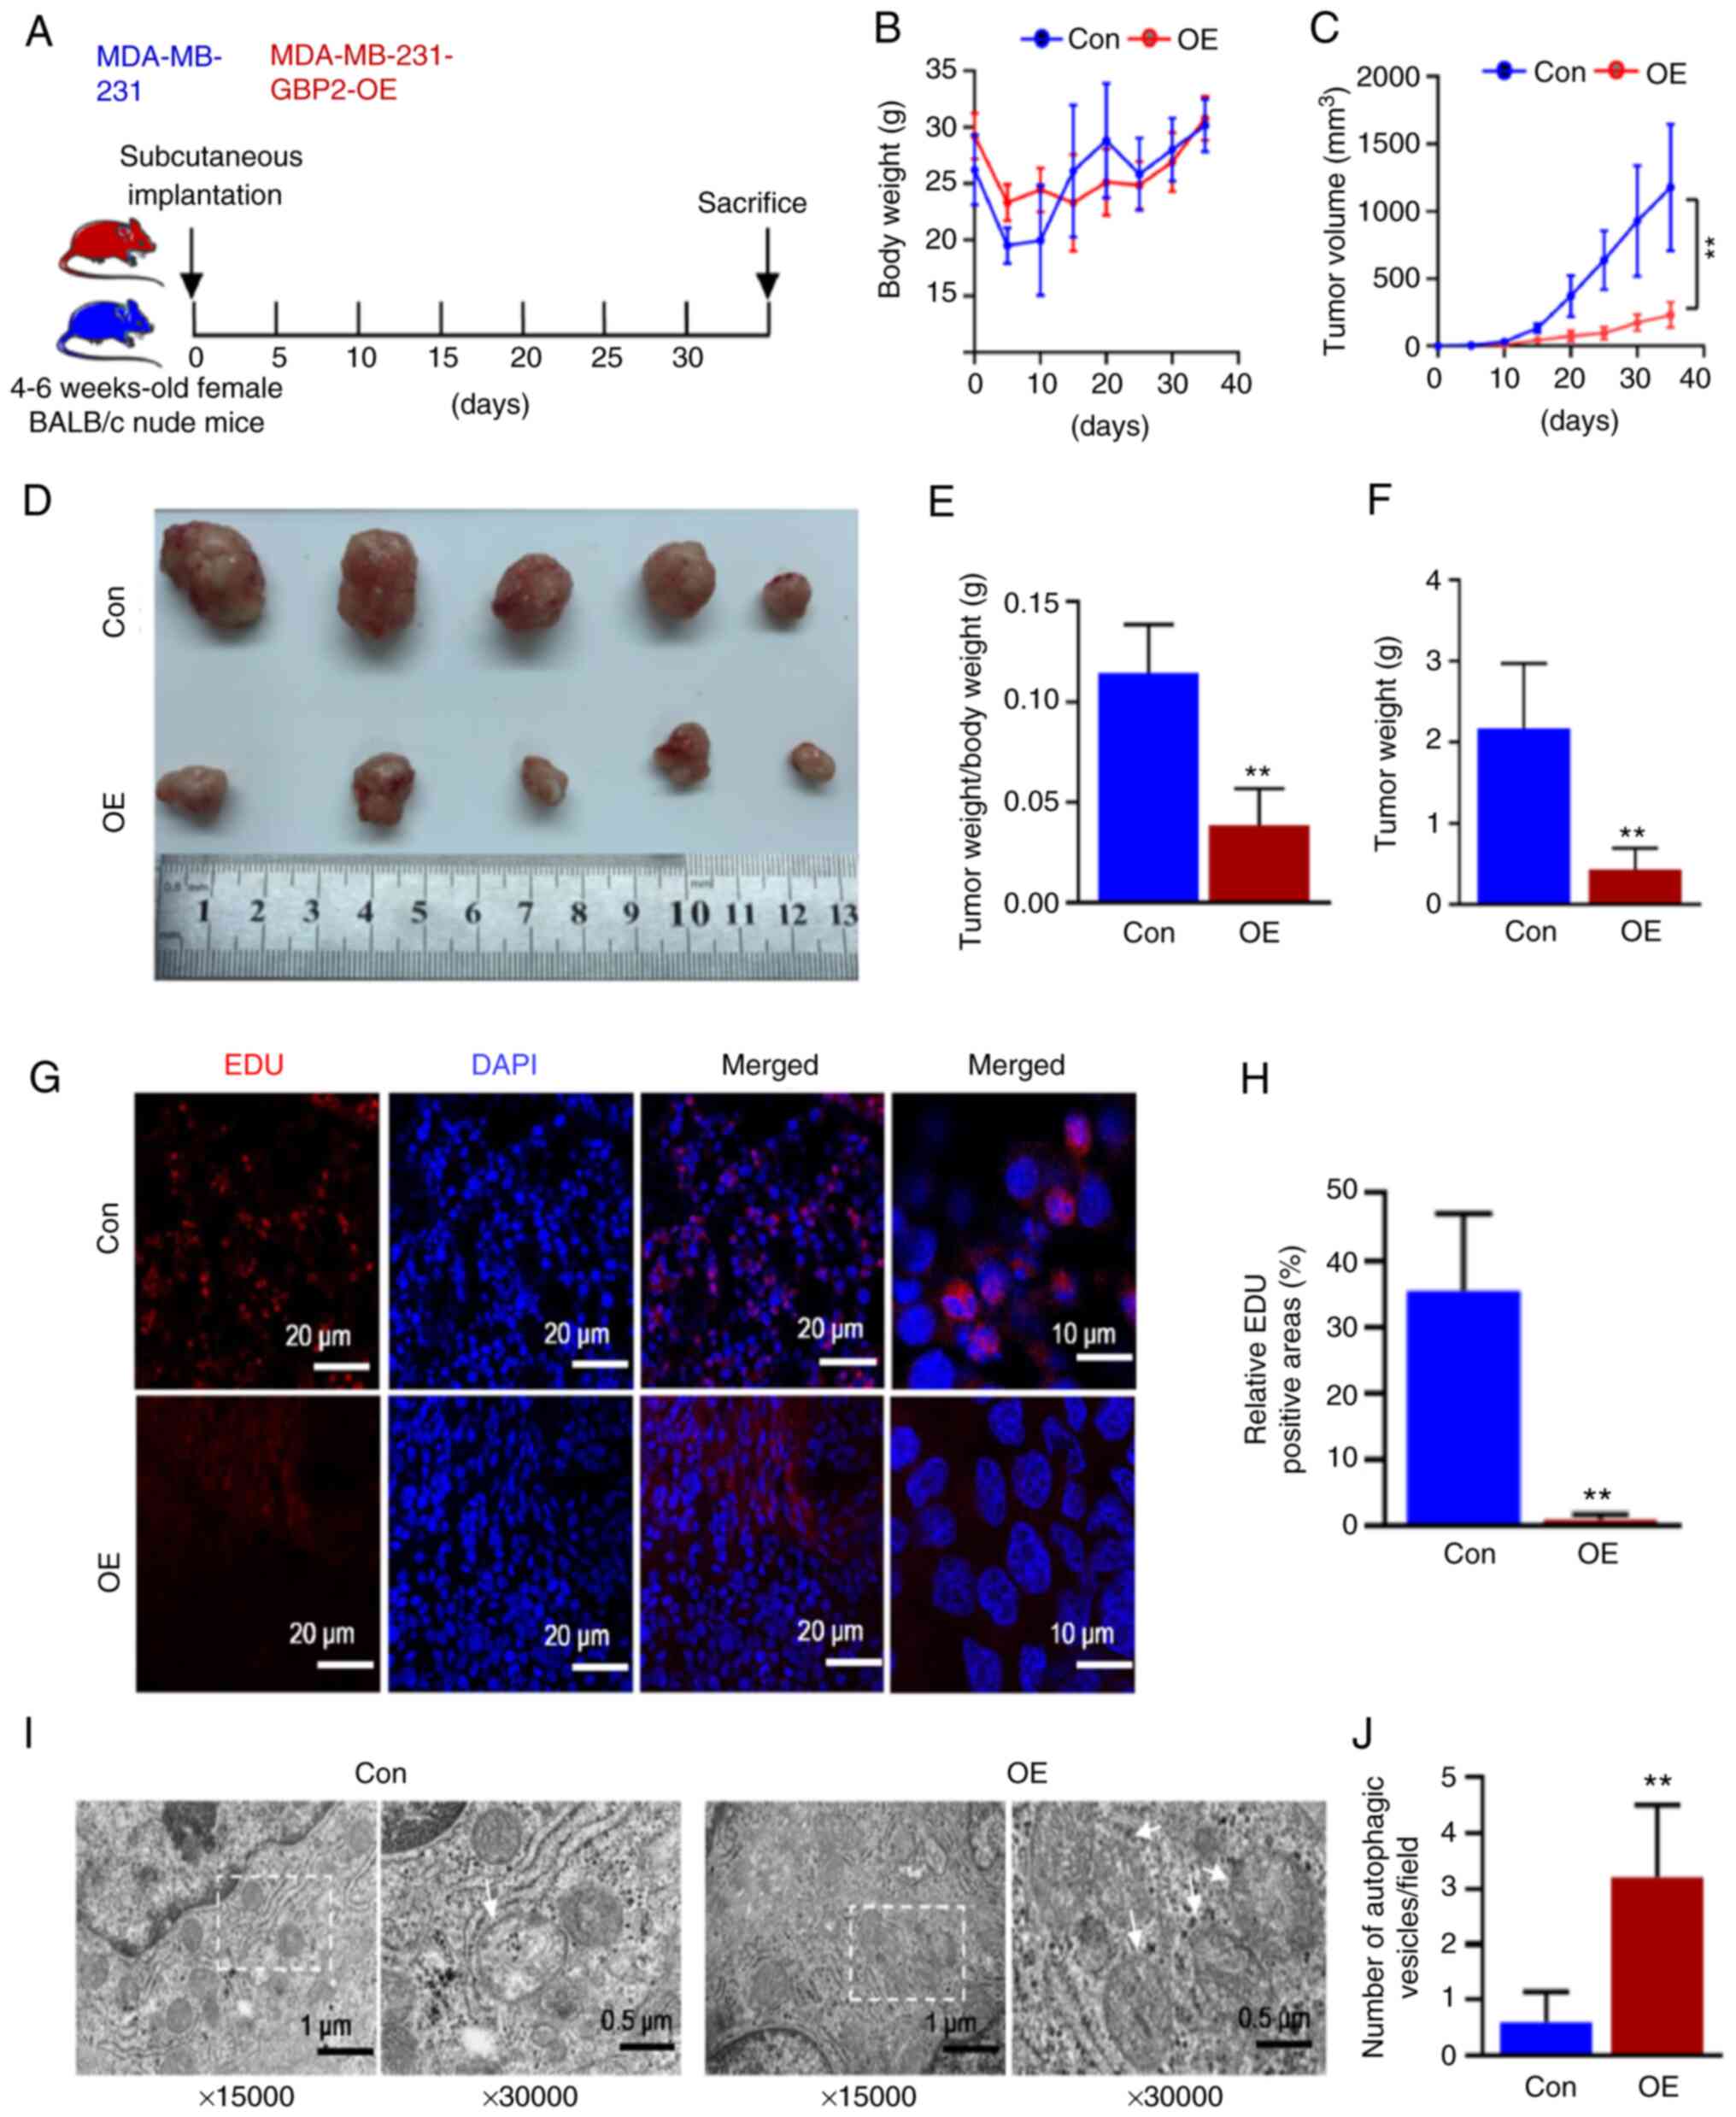
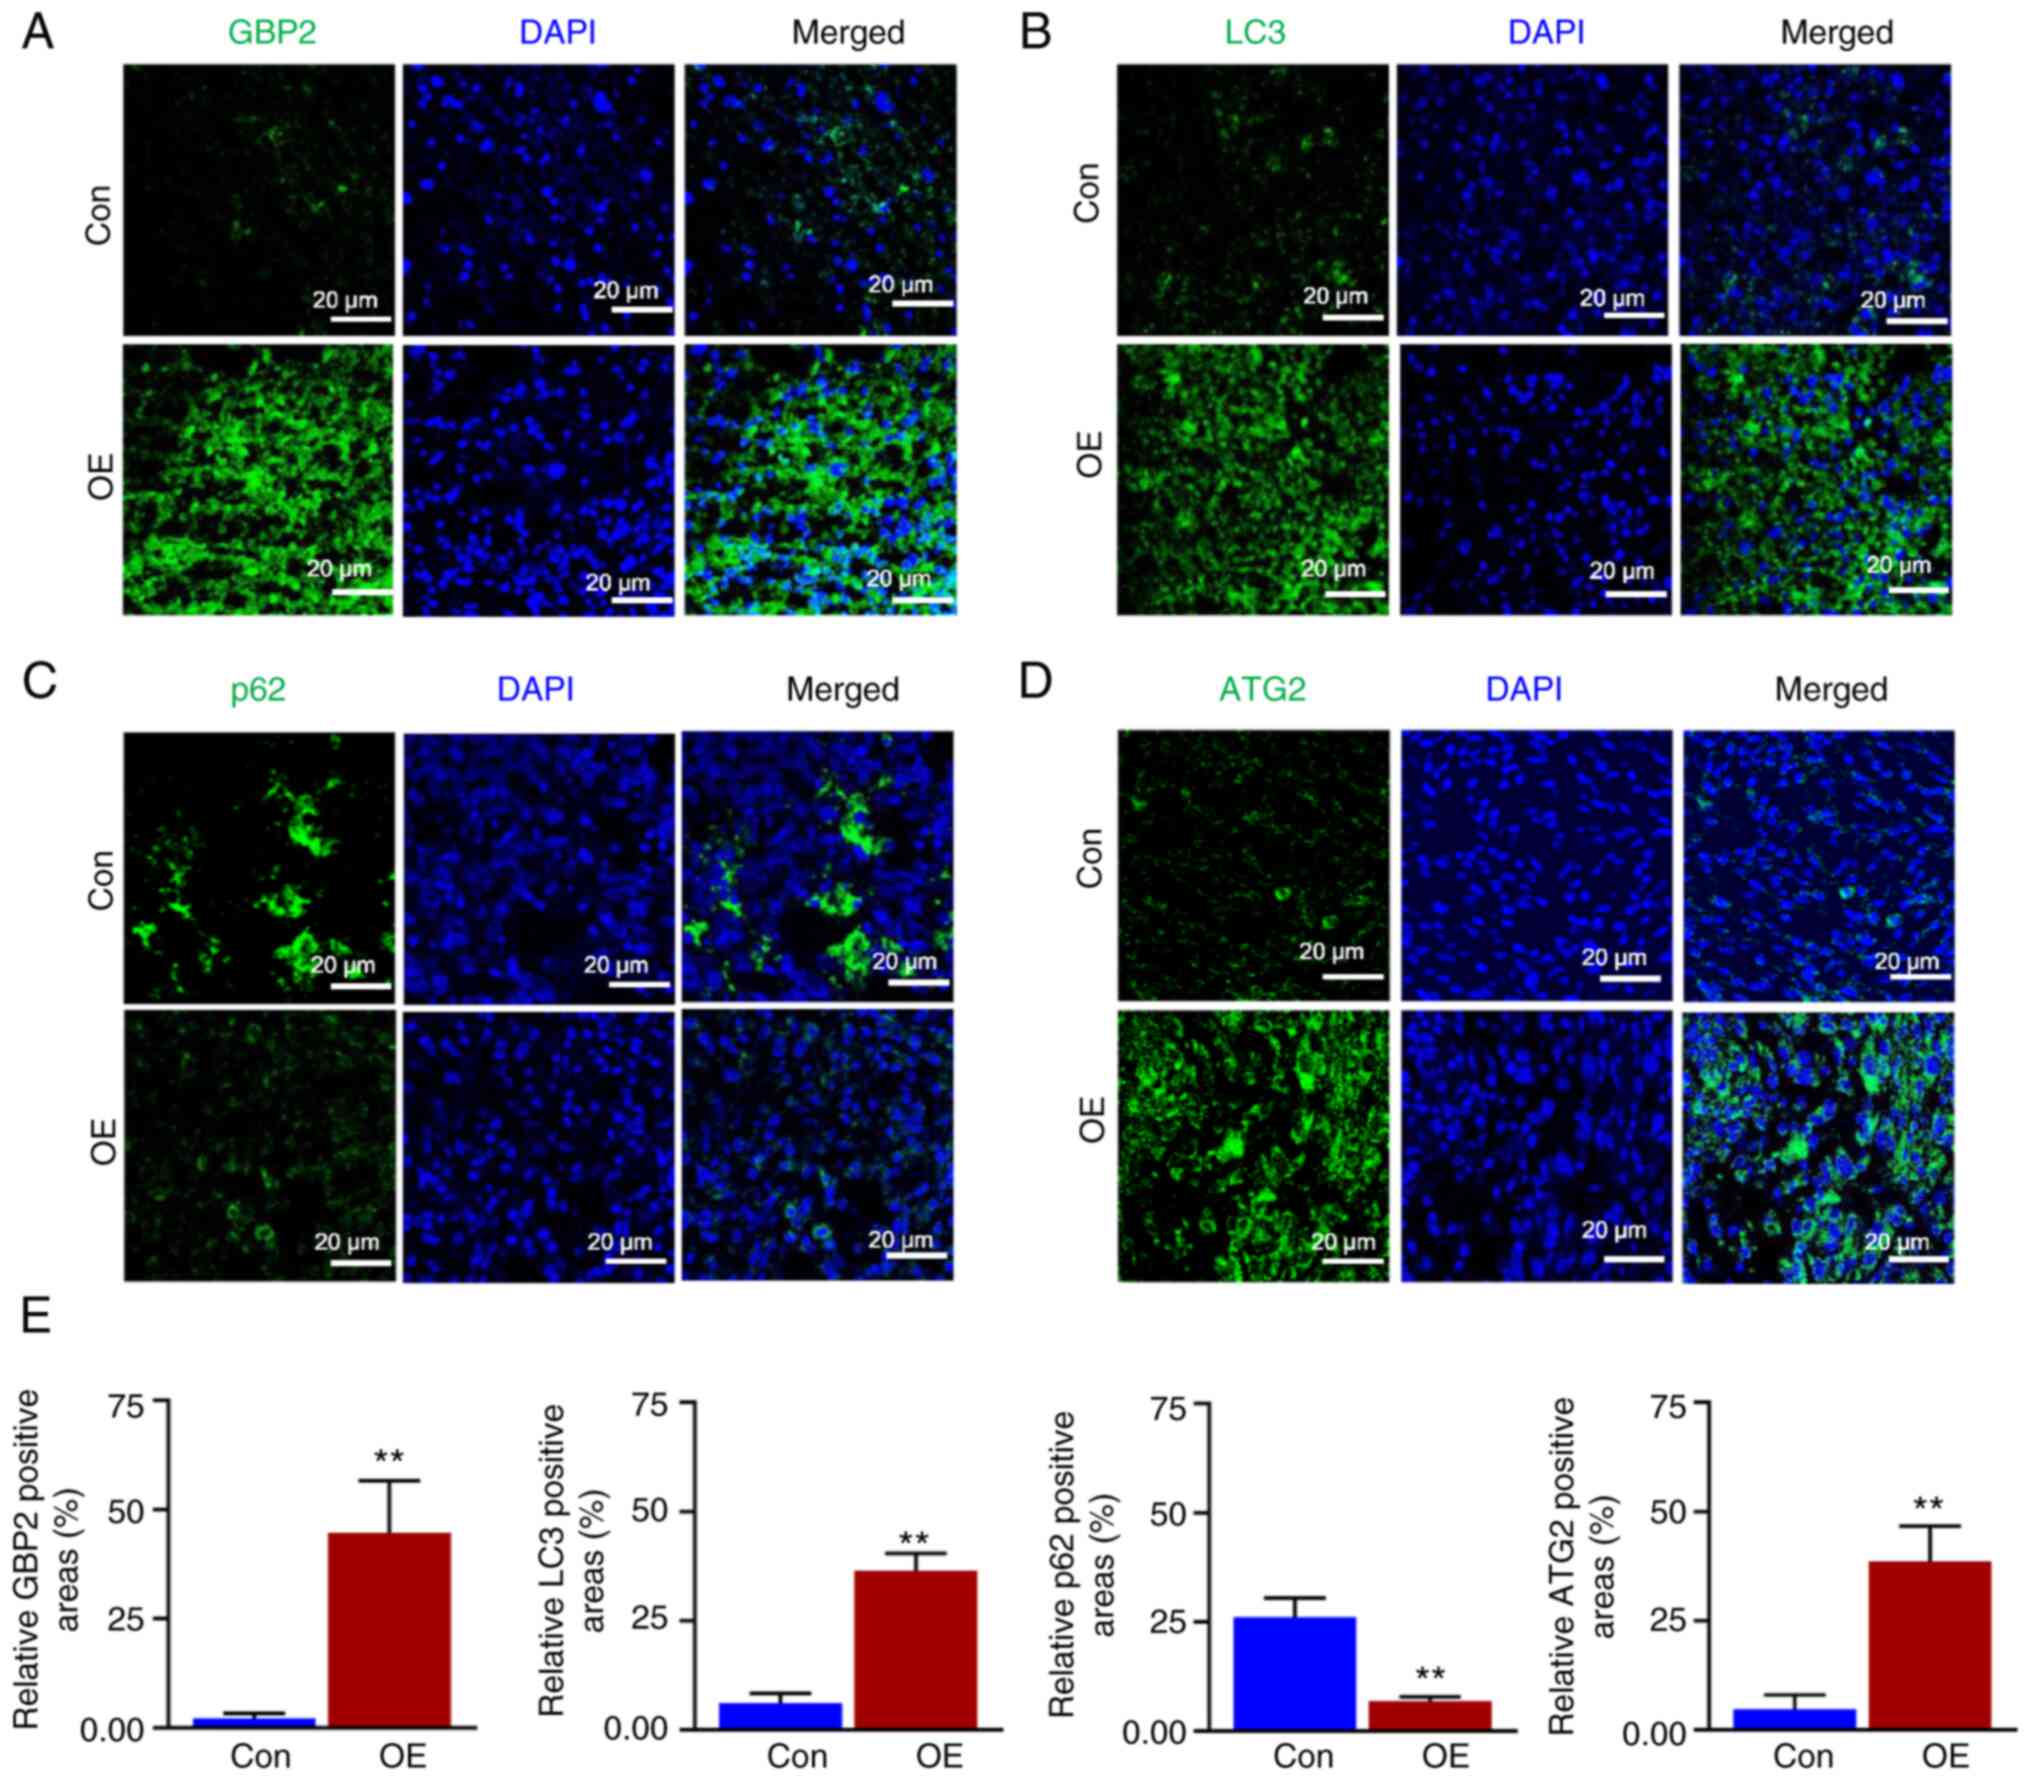
Subsequently, the tumors were sectioned and BrdU staining experiments were performed. Confocal microscopy revealed that the EDU red fluorescence in the OE group was considerably weaker (Fig. 8G). The fluorescence intensity was quantified (Fig. 8H), demonstrating that the growth of tumor cells was significantly reduced in the OE group. According to electron microscopy findings (Fig. 8I and J), the OE group had significantly more autophagic vesicles per unit of area, indicating enhanced autophagy. Fluorescence staining experiments were performed (Fig. 9A-D), and the relative fluorescence positivity was quantified using histograms (Fig. 9E). The level of GBP2 expression was significantly greater in the OE group than in the control group, thus confirming that GBP2 was overexpressed in the OE group (Fig. 9A), and the expression level of the LC3 protein related to autophagy was significantly higher in the OE group than in the control group (Fig. 9B); the autophagic substrate p62 was significantly lower (Fig. 9C), confirming that the overexpression of GBP2 enhanced autophagy in TNBC in vivo. Additionally, the outcomes demonstrated a parallel upward trend in ATG2 and GBP2 expression levels (Fig. 9A and D), which confirmed that GBP2 and ATG2 expression levels were positively associated and jointly enhanced autophagy in vivo.
Discussion
The present study was conducted to investigate the function of GBP2 in TNBC, particularly PTX-resistant TNBC, by utilizing numerous in vivo and in vitro experiments. The results indicated that forced expression of GBP2 in TNBC cells led to decreased cell proliferation, invasion and migration. Notably, it was revealed that that the overexpression of GBP2 significantly activated cellular autophagy. The mechanism underlying this effect was further elucidated, revealing that GBP2 enhanced autophagy by inhibiting the PI3K/AKT/mTOR pathway and interacting with ATG2. Consequently, activation of autophagy increases TNBC cell sensitivity to PTX. These results highlighted the anticancer role of GBP2 in TNBC and demonstrated its ability to promote autophagic cell death, which improves PTX resistance.
GBP2 is expressed in numerous tumor cells at different levels and plays distinct roles. The current results indicated the detection of GBP2 in the nucleoplasm and cytoplasm of TNBC, which is consistent with the findings of The Human Protein Atlas database (https://www.proteinatlas.org/ENSG00000162645-GBP2/subcellular), but a more precise localization deserves to be verified by further experiments. GBP2 is upregulated in esophageal squamous carcinoma, glioblastoma, and renal clear cell carcinoma and plays a significant pro-cancer role (6-8). The expression level of GBP2 was noticeably reduced in both colorectal cancer cells and cutaneous melanoma, which exhibited anti-cancer properties (9,10). However, further study is required to determine the role of GBP2 in TNBC. Notably, the present study confirmed low GBP2 expression in TNBC cells, verified by cellular RT-qPCR, WB and pathological tissue IHC experiments. Previous bioinformatics analysis by the authors revealed that GBP2 expression levels in TNBC were lower compared with those in normal breast tissues (Zhang et al, unpublished data). Notably, in previous immunohistochemical staining experiments by the authors, no instances of high GBP2 expression in TNBC samples were observed. However, the limited sample size prevented the authors from identifying individual cases of IHC staining indicating high GBP2 expression in TNBC. It is possible that further investigation with a larger sample set may uncover instances of high GBP2 expression. Previous studies and the current analysis using online resources have identified that patients with TNBC who express low levels of GBP2 have a poorer prognosis, suggesting that GBP2 may conduct an essential function in the progress of TNBC. In vitro experiments illustrated that overexpressing GBP2 significantly reduced the proliferation, migration and invasion of TNBC cells, confirming that hypothesis. In vivo, tumors in the GBP2 overexpression group revealed significant growth inhibition in a subcutaneous transplantation model of TNBC mice. EDU staining suggested that GBP2 overexpression significantly reduced tumor proliferation; GBP2 overexpression significantly enhanced the autophagy level of tumor cells by immunofluorescence detection. In brief, the present study revealed for the first time, to the best of the authors' knowledge, that GBP2 inhibits TNBC cell progression both in vitro and in vivo. Since GBP2 has been demonstrated to inhibit colon cancer proliferation through the Wnt pathway (9), and to promote glioma invasion through the Stat3-fibronectin pathway (7), together with the present current experimental results, it is reasonable to assume that GBP2 also modulates the malignant behavior of TNBC by affecting some independent signaling pathway, but this needs to be explored in further experiments. Meanwhile, outcomes suggested that overexpression of GBP2 activates autophagy, which may be the key reason for stronger cell death. Therefore, the present study focused on autophagy activation by GBP2.
Autophagy is essential for the development and advancement of breast cancer and influences breast cancer cell proliferation, invasion, migration and drug resistance (32). As research progresses, the key role of autophagy in TNBC has emerged, providing new therapeutic paradigms (29). However, autophagy performs a complex function in tumor progression, and it exhibits functions that inhibit or promote tumor progression in different tumor types and experimental models (33); several studies have revealed that autophagy protects TNBC tumor cells and the tumor microenvironment from cell proliferation, invasion and migration (34-36). Conversely, higher levels of ATG7 expression induce apoptosis in TNBC cells (37), and anti-CD73 monoclonal antibody-induced autophagy impedes TNBC cells from migrating and encroaching (38). This finding demonstrates that autophagy acts as a tumor suppressor in TNBC. The findings of the present study indicated that in vitro experiments, including examination of autophagic vesicles by electron microscopy, detection of autophagy-associated proteins by WB, observation of immunofluorescence under confocal microscopy and in vivo experiments of fluorescence staining in tumor sections, suggested that the autophagic flux of TNBC cells was significantly enhanced after overexpression of GBP2. To determine whether activated autophagy acts as a mechanism of cell death or protection (39), cells were treated with reagents to suppress autophagy, and the results suggested that cell growth was restored after autophagy inhibition, demonstrating that pro-death autophagy activated by GBP2 is crucial in inhibiting TNBC progression.
Further experiments were performed to explore the specific mechanisms of GBP2 autophagy activation. Previous studies have identified several autophagic pathways (40) including the Ampk (41,42), MAPK/JNK (43) and Wnt/β-catenin pathways (44). Notably, the PI3K/AKT/mTOR pathway has a significant effect on autophagy (45), and mTOR signaling is highly correlated with autophagy regulation (46). The present study indicated that the overexpression of GBP2 in MDA-MB-231 cells decreased the phosphorylation of PI3K/AKT/mTOR pathway proteins significantly; however, the application of CC, an Ampk inhibitor upstream of mTOR, activated the mTOR expression and restored the vitality. This demonstrated that GBP2 overexpression activated pro-death autophagy in MDA-MB-231 cells by inhibiting the PI3K/AKT/mTOR pathway.
Simultaneously, it was explored whether GBP2 could link proteins closely related to autophagy in eliciting its effect. In vitro, the WB assay of MDA-MB-231 cells overexpressing GBP2 indicated a noticeable rise in ATG2 compared with parental cells, while no significant difference was observed with ATG5. In vivo, tumor tissue immunofluorescence staining revealed that the GBP2 overexpression had elevated ATG2 expression. Subsequently, the results of immunofluorescence co-localization suggested that the protein regions of GBP2 and ATG2 significantly overlapped. These outcomes indicated that GBP2 and ATG2 exert synergistic effects on autophagy. Recent research has centered on the identification of a protein or factor that interacts with ATG2 to preserve efficient lipid transference during autophagy and provides energy for unidirectional transport (47). Based on the results of the current study and GBP2 being a member of the GTPase superfamily, which is closely related to energy metabolism, it can be inferred (for the first time) that GBP2 is a protein that closely synergizes with ATG2 to enhance autophagy. However, the specific mechanisms of the interaction between GBP2 and ATG2 require further experimental exploration.
PTX is typically the primary chemotherapy drug used to treat TNBC. However, the emergence of drug resistance has resulted in a poor patient prognosis. Hence there is an urgent need to address this issue. Wang et al (9) revealed that GBP2 could improve the chemosensitivity of colorectal cancer cells. Notably, the expression level of GBP5 (a cognate family of GBP2) was correlated with PTX resistance (48); GBP5 expression level was associated with PTX resistance. In a recent study by the authors (49), a biomarker model with a strong predictive ability for chemotherapy response in breast cancer was constructed, with GBP2 being a crucial member. The aforementioned study confirmed that GBP2 overexpression can significantly affect the autophagy of TNBC cells, and autophagy is crucial in PTX resistance (21). Therefore, it is reasonable to assume that GBP2-activated autophagy is related to PTX sensitivity in TNBC. A PTX-resistant strain of MDA-MB-231 cells was firstly established and GBP2 was subsequently overexpressed in the resistant strain by adenoviral transfection; the IC50 values of PTX were significantly reduced after treatment relative to the control group. These results suggested that the increased sensitivity of TNBC resistant cells to PTX was observed after the overexpression of GBP2. Collectively, it has been already confirmed that GBP2 overexpression can significantly enhance autophagy in TNBC cells, therefore it could be hypothesized that GBP2-activated autophagy is the cause of the reversal of drug resistance in TNBC. To prove this, a rescue experiment in which the autophagy inhibitor CQ was added on the basis of GBP2 overexpression was performed, and the results showed that the sensitivity of the cells to PTX decreased again, suggesting that the activation of autophagy contributed to the enhanced sensitivity to PTX. Since the present study has confirmed that one of the mechanisms by which GBP2 activates autophagy is through inhibition of PI3K/AKT/mTOR, mTOR activator CC was added to GBP2 overexpression and decreased PTX sensitivity was also observed. This further proved that autophagy activated by GBP2 overexpression causes the reversal of TNBC drug resistance. However, in addition to its use as an autophagy inhibitor, CQ is now widely used as an antimalarial and rheumatologic drug with apoptotic and necrotic and immunomodulatory/anti-inflammatory properties (50), thus there is still the possibility of potential effects on cells other than autophagy. CC also has potential effects on kinases other than AMPK (51). These effects were therefore considered by the authors and their evaluation in future experiments is considered.
Several studies have highlighted autophagy-induced enhancement of PTX sensitivity. For example, treatment of PTX-resistant thyroid cancer cells with a dual mTOR inhibitor, vizusertib, led to a substantial decrease in the IC50 of PTX; notably, cells treated with the combination of the two compounds accumulated more autophagic vesicles (52). In addition, natural compounds (53) and recombinant proteins/antibodies (54,55) enhance the cytocidal effects of PTX by inducing autophagy. Although there appears to be a dearth of ongoing clinical trials that concentrate on utilizing cytotoxic autophagy as a viable treatment option for TNBC, autophagy induction combined with PTX has great therapeutic potential and deserves further extensive investigations, which emphasizes the clinical significance of the present study.
The present study still has certain limitations. In the CCK-8 assay to assess cell viability, efforts were made to minimize error by consistently adding the same number of cells to each well at the experiment's outset, uniformly measuring the OD value at a wavelength of 450 nm, and averaging the results from three wells. However, it was challenging to predict whether the OD value would fall within the range most consistent with the linearity rule, which is between 0.75-1.25. Therefore, the limitation is acknowledged and more precise experimental design will be pursued in future endeavors. In the follow-up experiments involving the autophagy activation mechanism and drug sensitivity, only MDA-MB-231 cells were selected but not MDA-MB-436 cells, which was based on the fact that the expression of GBP2 was relatively lower in both parental and PTX-resistant MDA-MB-231 cells. Therefore, under the time constraints, it was subsequently chosen to perform the follow-up experiments with only MDA-MB-231 cells. There are certain related studies in which investigators made similar decisions (56-58). However, results should be also validated in MDA-MB-436 cells in future experiments to increase the rigor of the results.
In summary, the present study demonstrated that GBP2 is a prognostically relevant marker for TNBC, and it exerts tumor-suppressive activities such as inhibition of proliferation, migration and invasion. Notably, GBP2 enhances PTX sensitivity in TNBC by promoting autophagy. Mechanistically, the positive regulation of autophagy by GBP2 involves its inhibition in PI3K/AKT/mTOR signaling pathway and engagement with ATG2. These findings enable an understanding of the mechanisms underlying the GBP2-mediated reversal of chemotherapy resistance in TNBC cells and highlight GBP2 as a potential therapeutic target for overcoming drug resistance in TNBC.
Supplementary Data
Availability of data and materials
All data generated or analyzed during this study are included in this published article.
Authors' contributions
WZ and SL conceived the study and designed the experiments. WZ conducted the experiments and wrote the manuscript. XT and YP carried out bioinformatics and data analysis. YX, LL, WZ and SL confirm the authenticity of all the raw data, collaborated on the figures, edited the manuscript, and contributed to data interpretation. All authors thoroughly reviewed the final manuscript. All authors read and approved the final version of the manuscript.
Ethics approval and consent to participate
All animal experiments were approved (approval no. 2022-0016) by The Animal Experimentation Ethics Committee of Chongqing Medical University (Chongqing, China). Approval for the utilization of clinical samples (approval no. 2020-279) was granted by The Review Board of the First Affiliated Hospital of Chongqing Medical University (Chongqing, China). Written informed consent was obtained from all patients.
Patient consent for publication
Not applicable.
Competing interests
The authors declare that they have no competing interests.
Acknowledgments
Not applicable.
Funding
The present study was supported by the Key Research and Development Project of Chongqing's Technology Innovation and Application Development Special Big Health Field (grant no. CSTC2021jscx-gksb-N0027), Chongqing Natural Science Foundation (grant no. CSTB2022NSCQ-MSX0940) and the Chongqing Tongliang Science and Technology Bureau Foundation (grant no. TL2021-04).