


TPR is a prognostic biomarker and potential therapeutic target associated with immune infiltration in hepatocellular carcinoma
- Authors:
- Published online on: February 8, 2024 https://doi.org/10.3892/mco.2024.2725
- Article Number: 27
-
Copyright: © Long et al. This is an open access article distributed under the terms of Creative Commons Attribution License.
Abstract
Introduction
Liver cancer is the sixth most commonly diagnosed cancer and the third leading cause of cancer-related mortality worldwide (1). Hepatocellular carcinoma (HCC) is the most common primary liver cancer and accounts for 75-85% of cases (2). Currently, the potentially curative treatments for HCC are ablation, surgical resection and transplantation (3). Despite the advances in chemotherapy, radiotherapy, immunotherapy and liver transplantation, HCC prognosis remains poor due to the high risk of recurrence and metastases (4). The highly heterogeneous nature of HCC leads to difficulties in diagnosing or predicting disease using existing biomarkers (5). Therefore, it is urgent to identify novel driver genes for HCC treatment, which will improve the survival of patients with HCC.
Translocated promoter region (TPR) is a coiled-coil homodimer and has a rod-like shape (6-8). TPR consists of two domains: An N-terminal domain consisting of ~1,600 amino acids that forms a parallel two-stranded coil and is interrupted periodically throughout its length, and a C-terminal domain that features 800 non-helical amino acids enriched in acidic residues (8-11). As with numerous transcription-regulating nucleoporins (NUPs), TPR is localized to the nucleus (12). In addition, TPR binds chromatin in vitro and is essential for the formation of heterochromatin exclusion zones near nuclear pore complexes (13,14). TPR plays a number of roles in the nucleus, including regulating the three prime repair exonuclease 2-dependent mRNA export pathway (15,16) and scaffolding ERK2(17) and MYC (18) enzymes. Several studies have demonstrated that TPR is implicated in multiple types of cancers, including lung adenocarcinoma (19,20), ependymoma (21), glioma (22) and colon cancer (23). However, little research has been conducted on HCC. Therefore, the purpose of the present study was to discover the potential mechanisms by which TPR may contribute to tumorigenesis and immune involvement in HCC.
The development of numerous database platforms has led to significant advances in cancer bioinformatics research, which allows researchers to screen markers for cancer more easily. Thus, in the present study, TPR was identified as a significantly upregulated gene in HCC using the Gene Expression Omnibus (GEO). To clarify the biological functions of TPR in HCC, Xiantao tool, The Cancer Genome Atlas (TCGA), the Genotype-Tissue Expression (GTEx) and the Kaplan-Meier (KM) Plotter were used to determine whether the expression of TPR was related to the clinical outcome of HCC. Next, gene-set enrichment of TPR was conducted using the Metascape database and Xiantao tool. In addition, investigation of TPR and immune cell infiltration was performed using Xiantao tool and the Tumor Immune Estimation Resource (TIMER) database. Finally, analyses of immune-modulators and chemokines were further conducted using data from the Tumor-Immune System Interactions Database (TISIDB). In the present study, TPR was identified as being important in HCC, and it was indicated that TPR may be involved in promoting tumor progression in cells.
Materials and methods
Patient datasets
The gene expression profile data (GSE36376, GSE39791 and GSE60502) were downloaded from the GEO (http://www.ncbi.nlm.nih.gov/geo/geo2r) (24-26). The inclusion criteria for genomics data were as follow: i) The samples were obtained from Homo sapiens; ii) all tissues were classified as HCC or normal tissues; and iii) the sample sizes were >10 per study. GSE36376 included 240 HCC tumor tissues and 193 adjacent non-tumor tissues; GSE39791 included 72 tumor tissues and 72 matched adjacent non-tumor tissues; GSE60502 included 18 tumor tissues and 18 adjacent non-tumor tissues. GEO2R (http://www.ncbi.nlm.nih.gov/geo/geo2r) was used to analyze differentially expressed genes (DEGs) between HCC and non-tumor samples. The cut-off was set as |log2 fold change (FC)|>1 and adjusted P<0.01. TPR expression and clinical data were obtained from TCGA (https://portal.gdc.cancer.gov/) and GTEx (https://gtexportal.org/home/). Given that the data were obtained from the online databases, additional approval from an ethics committee was not required.
Analysis of TPR expression in tumor and normal tissues
Xiantao tool (https://www.xiantao.love/) is a platform using R software (3.6.3) for acquiring data from TCGA and GTEx. TPR expression in HCC tissues, tissues adjacent to carcinoma and normal tissues was compared using Xiantao tool and presented in box, scatter and violin plots. Diagnostic performance of TPR was assessed using receiver-operating characteristic curves performed on Xiantao tool. All the DEGs (|log2FC|>1.5 and adjusted P<0.05) gained from single gene differential analysis through Xiantao tool were presented in volcano plots.
Human tissue specimens
A total of 14 pairs of HCC and matched normal fresh frozen tissues were obtained through hepatectomy at Sun Yat-sen University Cancer Center (Guangzhou, China), from 2019 to 2021 (12 males and 2 females, ages from 20 to 78 years with an average age of 56). The patients were diagnosed according to their clinicopathologic characteristics at the Sun Yat-sen University Cancer Center. No patients had received radiotherapy and/or chemotherapy prior to surgery. Informed consent was obtained from all patients and approved (approval no. B2022-238-02) by the Research Medical Ethics Committee of Sun Yat-sen University Cancer Center.
Cell culture
The liver cancer cell lines (Hep3B, SNU449, MHCC97H, Huh7, HepG2 and HCCLM3) were obtained from the American Type Culture Collection (ATCC) and cultured according to the instructions from the ATCC. All cells were grown in DMEM supplemented with 10% FBS (both from Invitrogen; Thermo Fisher Scientific, Inc.) at 37˚C and 5% CO2. All cell lines in the present study were authenticated utilizing short-tandem repeat profiling.
RNA extraction and reverse transcription-quantitative PCR (RT-qPCR)
The total RNA of the liver cancer cell lines (Hep3B, SNU449, MHCC97H, Huh7, HepG2 and HCCLM3) or tissue was isolated utilizing TRIzol® reagent (Invitrogen; Thermo Fisher Scientific, Inc.) according to the manufacturer's instructions. First-strand cDNA was synthesized utilizing the Revert Aid™ First Strand cDNA Synthesis Kit (Fermentas; Thermo Fisher Scientific, Inc.). The thermocycling conditions used were as follows: 37˚C for 15 min, 95˚C for 5 sec and were then cooled to 4˚C upon completion. Quantitative PCR assays were performed using a A28134 QuantStudio® 5 Real-Time PCR Instrument (Thermo Fisher Scientific, Inc.) and iTaq Universal SYBR Green Supermix reagent (Bio-Rad Laboratories, Inc.). The thermocycling conditions used were as follows: 95˚C for 30 sec, 40 cycles at 95˚C for 3 sec and 60˚C for 30 sec, then 60˚C for 20 sec and 95˚C for 1 sec. The relative expression of each gene was calculated using the 2-ΔΔCq method with GAPDH as the internal reference (27). The primers used to amplify the indicated genes are shown in Table SI.
Interaction network analysis
The GeneMANIA database (http://www.genemania.org) was used to explore the genes that interacted with TPR. The Search Tool for Interaction Gene/Proteins (STITCH) website (http://stitch.embl.de/) was used to analyze the protein-protein interactions of TPR.
Tumor immune infiltration analysis
TIMER (https://cistrome.shinyapps.io/timer/) and Xiantao tool were used to analyze the infiltration levels of different immune cells. TIMER was also applied to explore the interrelation between TPR expression and different gene marker sets of immune cells. The correlations were evaluated by purity-correlated partial Spearman's correlation. An integrated repository portal for TISIDB (http://cis.hku.hk/TISIDB/) was used to investigate the relationship between TPR and immunoinhibitors, immunostimulators, chemokines and receptors.
Enrichment analysis
Metascape (http://metascape.org/) and Xiantao tool was used to perform Gene Ontology (GO) and Kyoto Encyclopedia of Genes and Genomes (KEGG) analysis to explore the biological processes (BPs), cellular components (CCs) and molecular functions (MFs) of TPR in HCC. Gene Set Enrichment Analysis (GSEA) was used to probe the potential mechanisms of TPR performed on Xiantao tool. Gene sets with false discovery rate (FDR) <0.25 and P. adjust <0.05 were considered as significant.
Small interfering RNA (siRNA) treatment
The oligonucleotide sequences targeting TPR mRNA were as follows: #1, GCAGCTTGTTGATTCCATA (5'-3') and #2, GGAGCGATCTGAAACAGAA (5'-3') synthesized from Guangzhou RiboBio Co., Ltd. The siRNA negative control (siN0000001-1-5) is designed and produced by Guangzhou RiboBio Co., Ltd. and its sequence is proprietary (28). Transfection was performed according to the manufacturer's instructions using Lipofectamine RNAi MAX transfection reagent (Invitrogen; Thermo Fisher Scientific, Inc.) and 50 nM siRNA. siRNA transfection was performed at 37˚C for 6 h and the culture medium was then replaced with fresh culture medium. Follow-up procedures were performed 24 h later.
Western blotting (WB)
Briefly, the liver cancer cell lines Hep3B and SNU449 were collected, lysed in RIPA buffer (150 mM NaCl, 0.5% EDTA, 50 mM Tris, 0.5% NP40, pH=8.0) and centrifuged for 20 min at 13,500 x g and 4˚C. The protein concentration was measured using a BCA Protein Assay Kit (Beijing Solarbio Science & Technology Co., Ltd.). The proteins (20 µg/lane) were separated using SDS-PAGE electrophoresis in 4 to 20% polyacrylamide gels and transferred to PVDF membranes (Invitrogen; Thermo Fisher Scientific, Inc.). The PVDF containing protein membranes were blocked in 5% skim milk at room temperature for 120 min. The membranes were then incubated overnight with primary antibodies against AKT (1:1,000), phosphorylated (p)-AKT (1:1,000) or GAPDH (1:1,000) at 4˚C. Membranes were then washed with TBST with 0.1% Tween-20 and incubated with goat anti-rabbit IgG (H&L) HRP secondary antibodies (1:10,000) at 25˚C for 1 h. The protein bands were then visualized using the ECL chemiluminescence system (Pierce; Thermo Fisher Scientific, Inc.). The antibodies used in the present study are shown in Table SII.
3-(4,5-dimethylthiazol-2-yl)-2,5-diphenyltetrazolium bromide (MTT) assay
An MTT assay was conducted to measure cell viability. Briefly, SNU449 or Hep3B cells were seeded at a density of 2,000 cells per well in a 96-well microplate. The cells were incubated with MTT at 37˚C for 4 h, then the culture medium was removed, and 200 µl dimethylsulfoxide (DMSO) was added to dissolve the purple formazan. The optical density (OD) was detected at 490 nm with the microplate reader once per day for 5 days. The results are presented as the mean ± SD of three independent experiments.
Statistical analysis
Data were collected from three independent experiments. The GraphPad Prism 9 (GraphPad Software; Dotmatics) and the SPSS software (version 16.0, SPSS Inc.) were used for data analysis. Data were presented as the mean ± SD. Unpaired Student's t-test was used to analyze differences between groups and one-way analysis of variance with Tukey's post hoc test was used to analyze multiple groups. Survival analysis was performed using the KM method, and differences among the survival curves were analyzed with the log-rank test. The follow-up threshold was 30 months. Wilcoxon rank sum test was used to analyze α-fetoprotein (AFP). Dunn's test was used to analyze the pathological stage. Two-way ANOVA with Dunnett's multiple comparison test was used to analyze the MTT assays. P<0.05 was considered to indicate a statistically significant difference.
Results
High expression of TPR in HCC and pan-cancer
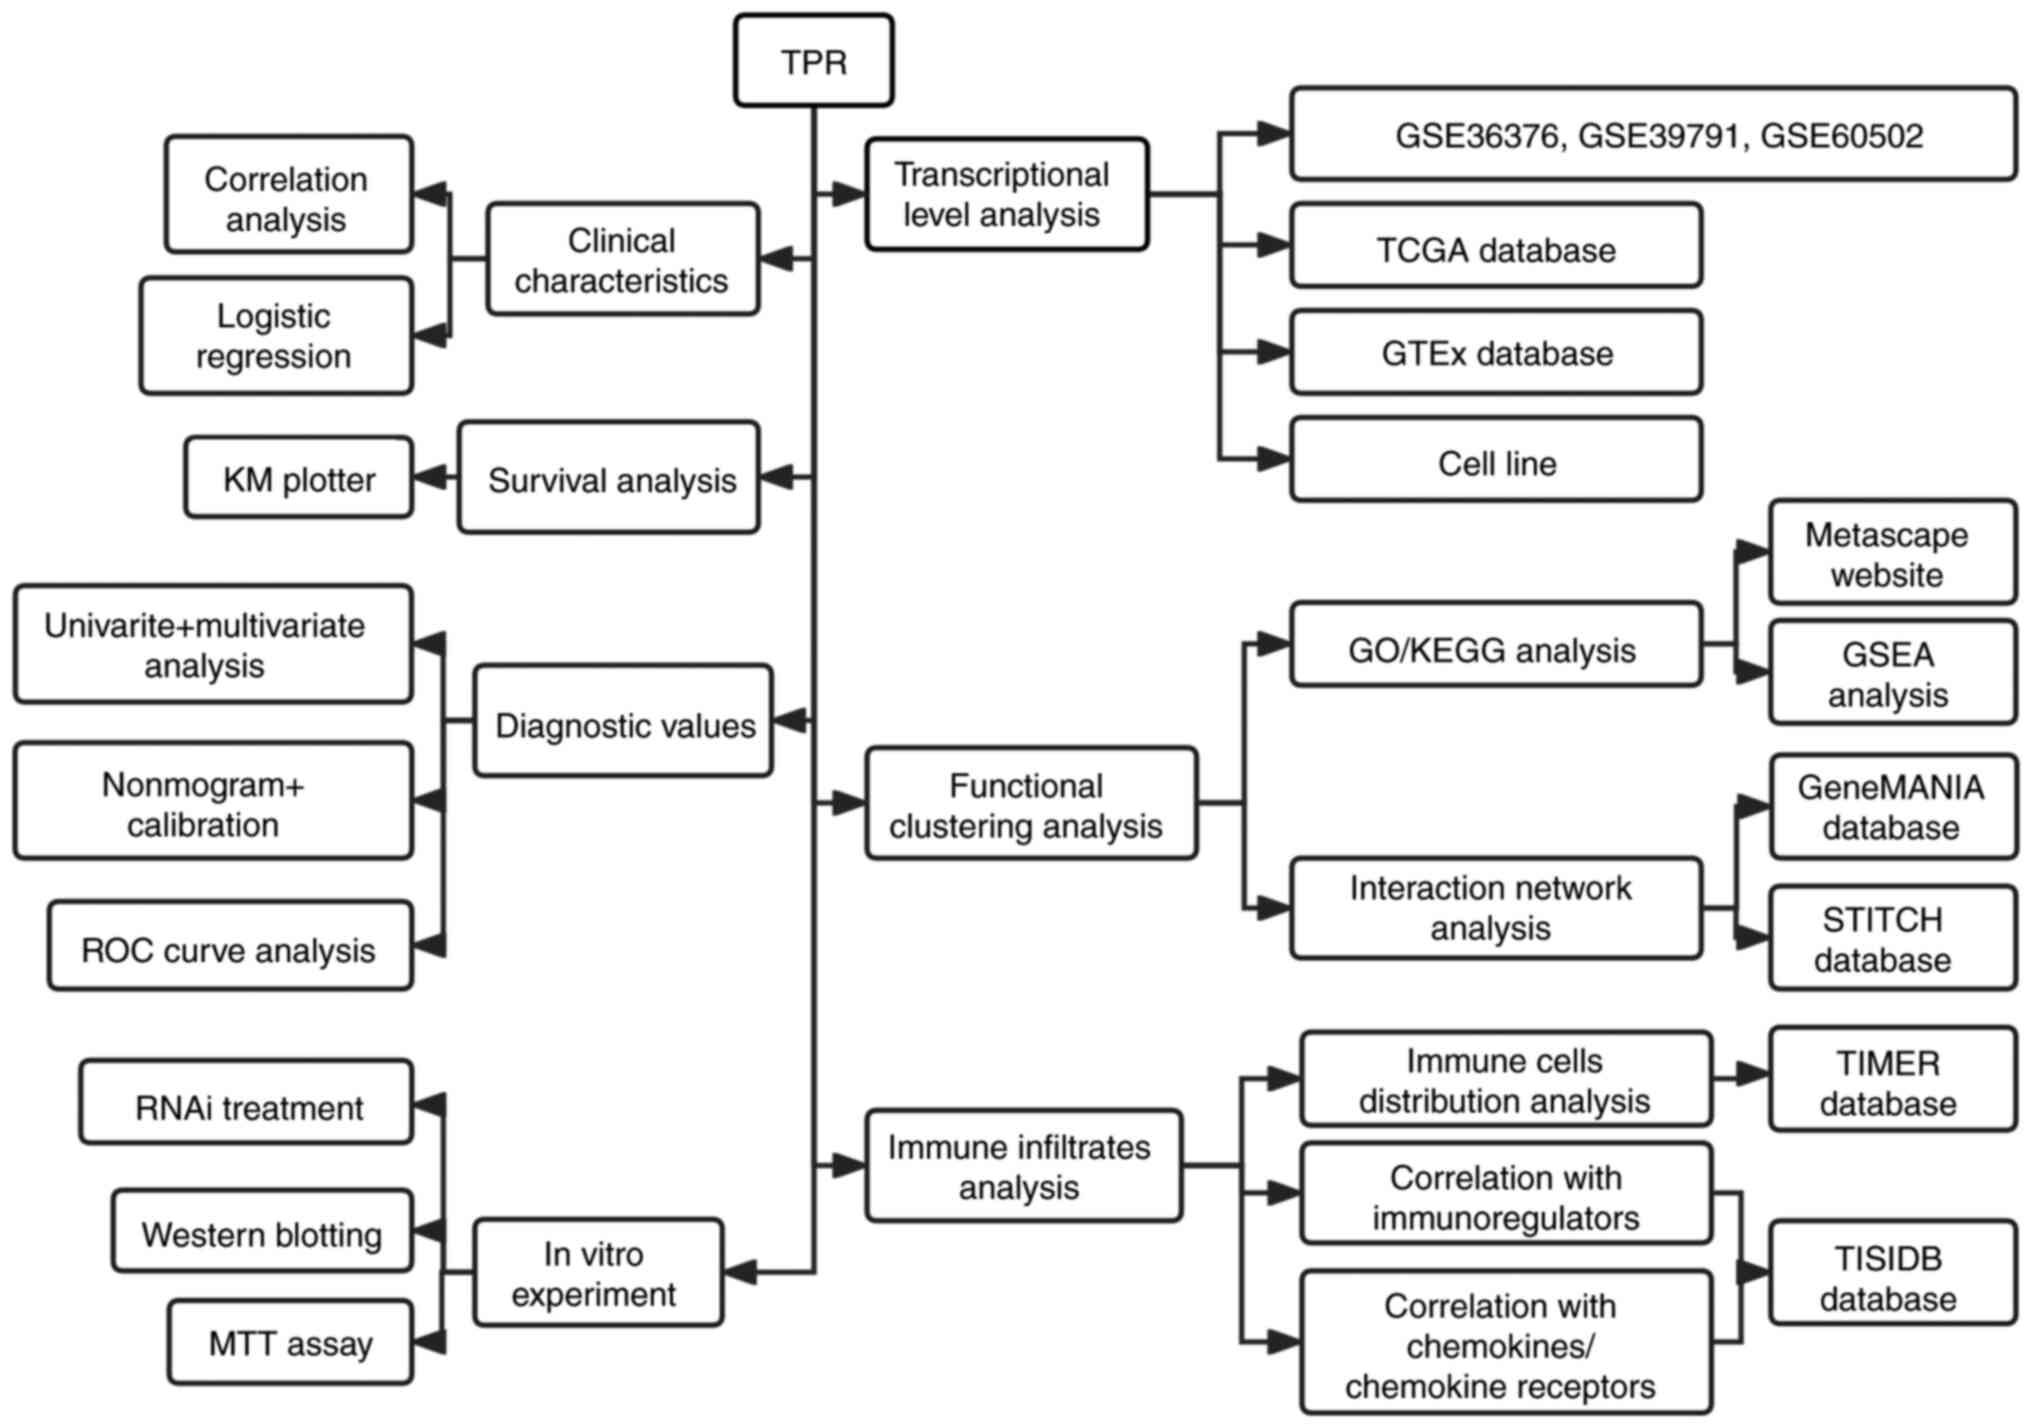
The flow diagram presented in Fig. 1 was constructed to reveal the process of the present study. To identify the key genes in the progression of HCC, GSE36376, GSE39791 and GSE60502 datasets were analyzed to explore the DEGs in HCC. As demonstrated by Venn diagram (Fig. 2A), 187 congruous DEGs were identified. Notably, TPR was the only upregulated gene and there were no downregulated genes included in the overlap of the three datasets (Figs. 2B and S1). An additional 186 genes were upregulated or downregulated in two datasets and expressed inversely in the other dataset.
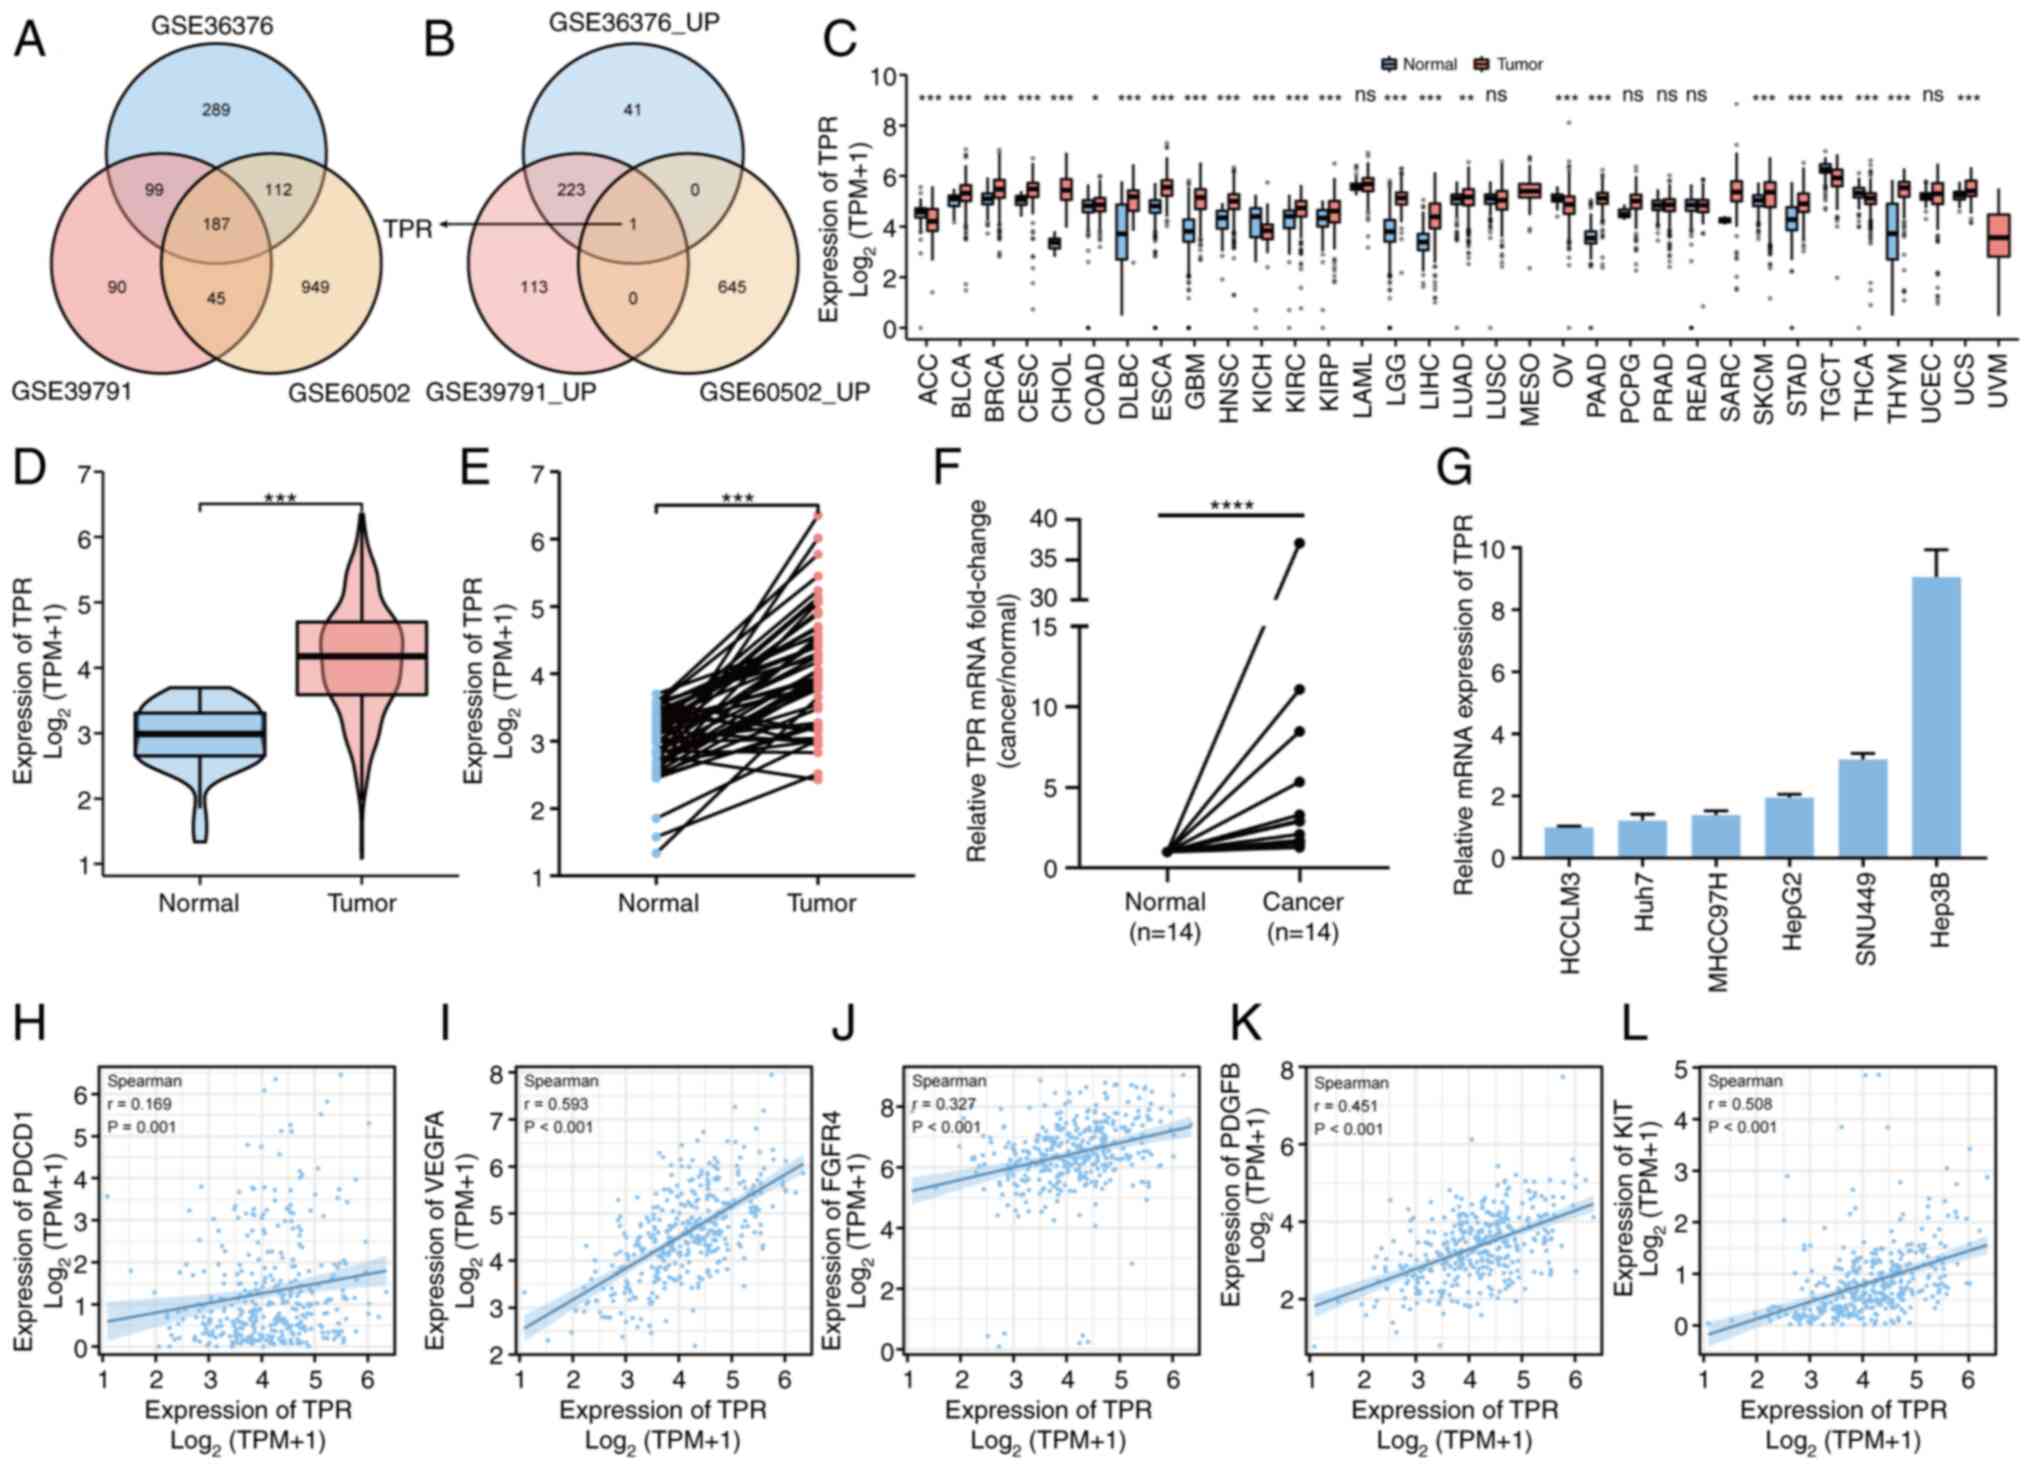
The differential expression of TPR in HCC tissues and normal tissues was then explored. Among the expression of TPR in 33 types of tumors assessed from TCGA and GTEx, 24 types expressed significantly more TPR than corresponding normal tissues, 6 types demonstrated no significant difference and 3 types lacked sufficient samples (Fig. 2C). It was further identified that the expression of TPR was significantly higher in 374 tumor cases compared with 50 normal cases (P<0.001; Fig. 2D) and 50 tumor tissues compared with their matched non-tumor tissues from TCGA (P<0.001; Fig. 2E).
Furthermore, RT-qPCR was used to determine TPR expression in 14 pairs of HCC and peritumoral tissues. The findings demonstrated a higher TPR expression in most tumor tissues (Fig. 2F). Subsequently, TPR expression was confirmed at the mRNA level in liver cancer cell lines (Fig. 2G). Next, the correlation of TPR expression with several types of current HCC therapeutic targets, including programmed cell death protein 1 (PDCD1) (29), vascular endothelial growth factor A (VEGFA) (30), fibroblast growth factor receptor 4 (FGFR4) (31), platelet derived growth factor subunit B (PDGFB) (32) and KIT proto-oncogene (KIT) (33), were investigated (Fig. 2H and L). Notably, there were markedly positive correlations between the expression of TPR and these targets. Collectively, these results demonstrated that TPR was highly expressed in HCC and was associated with several existing therapeutic targets.
Association between TPR and clinical features
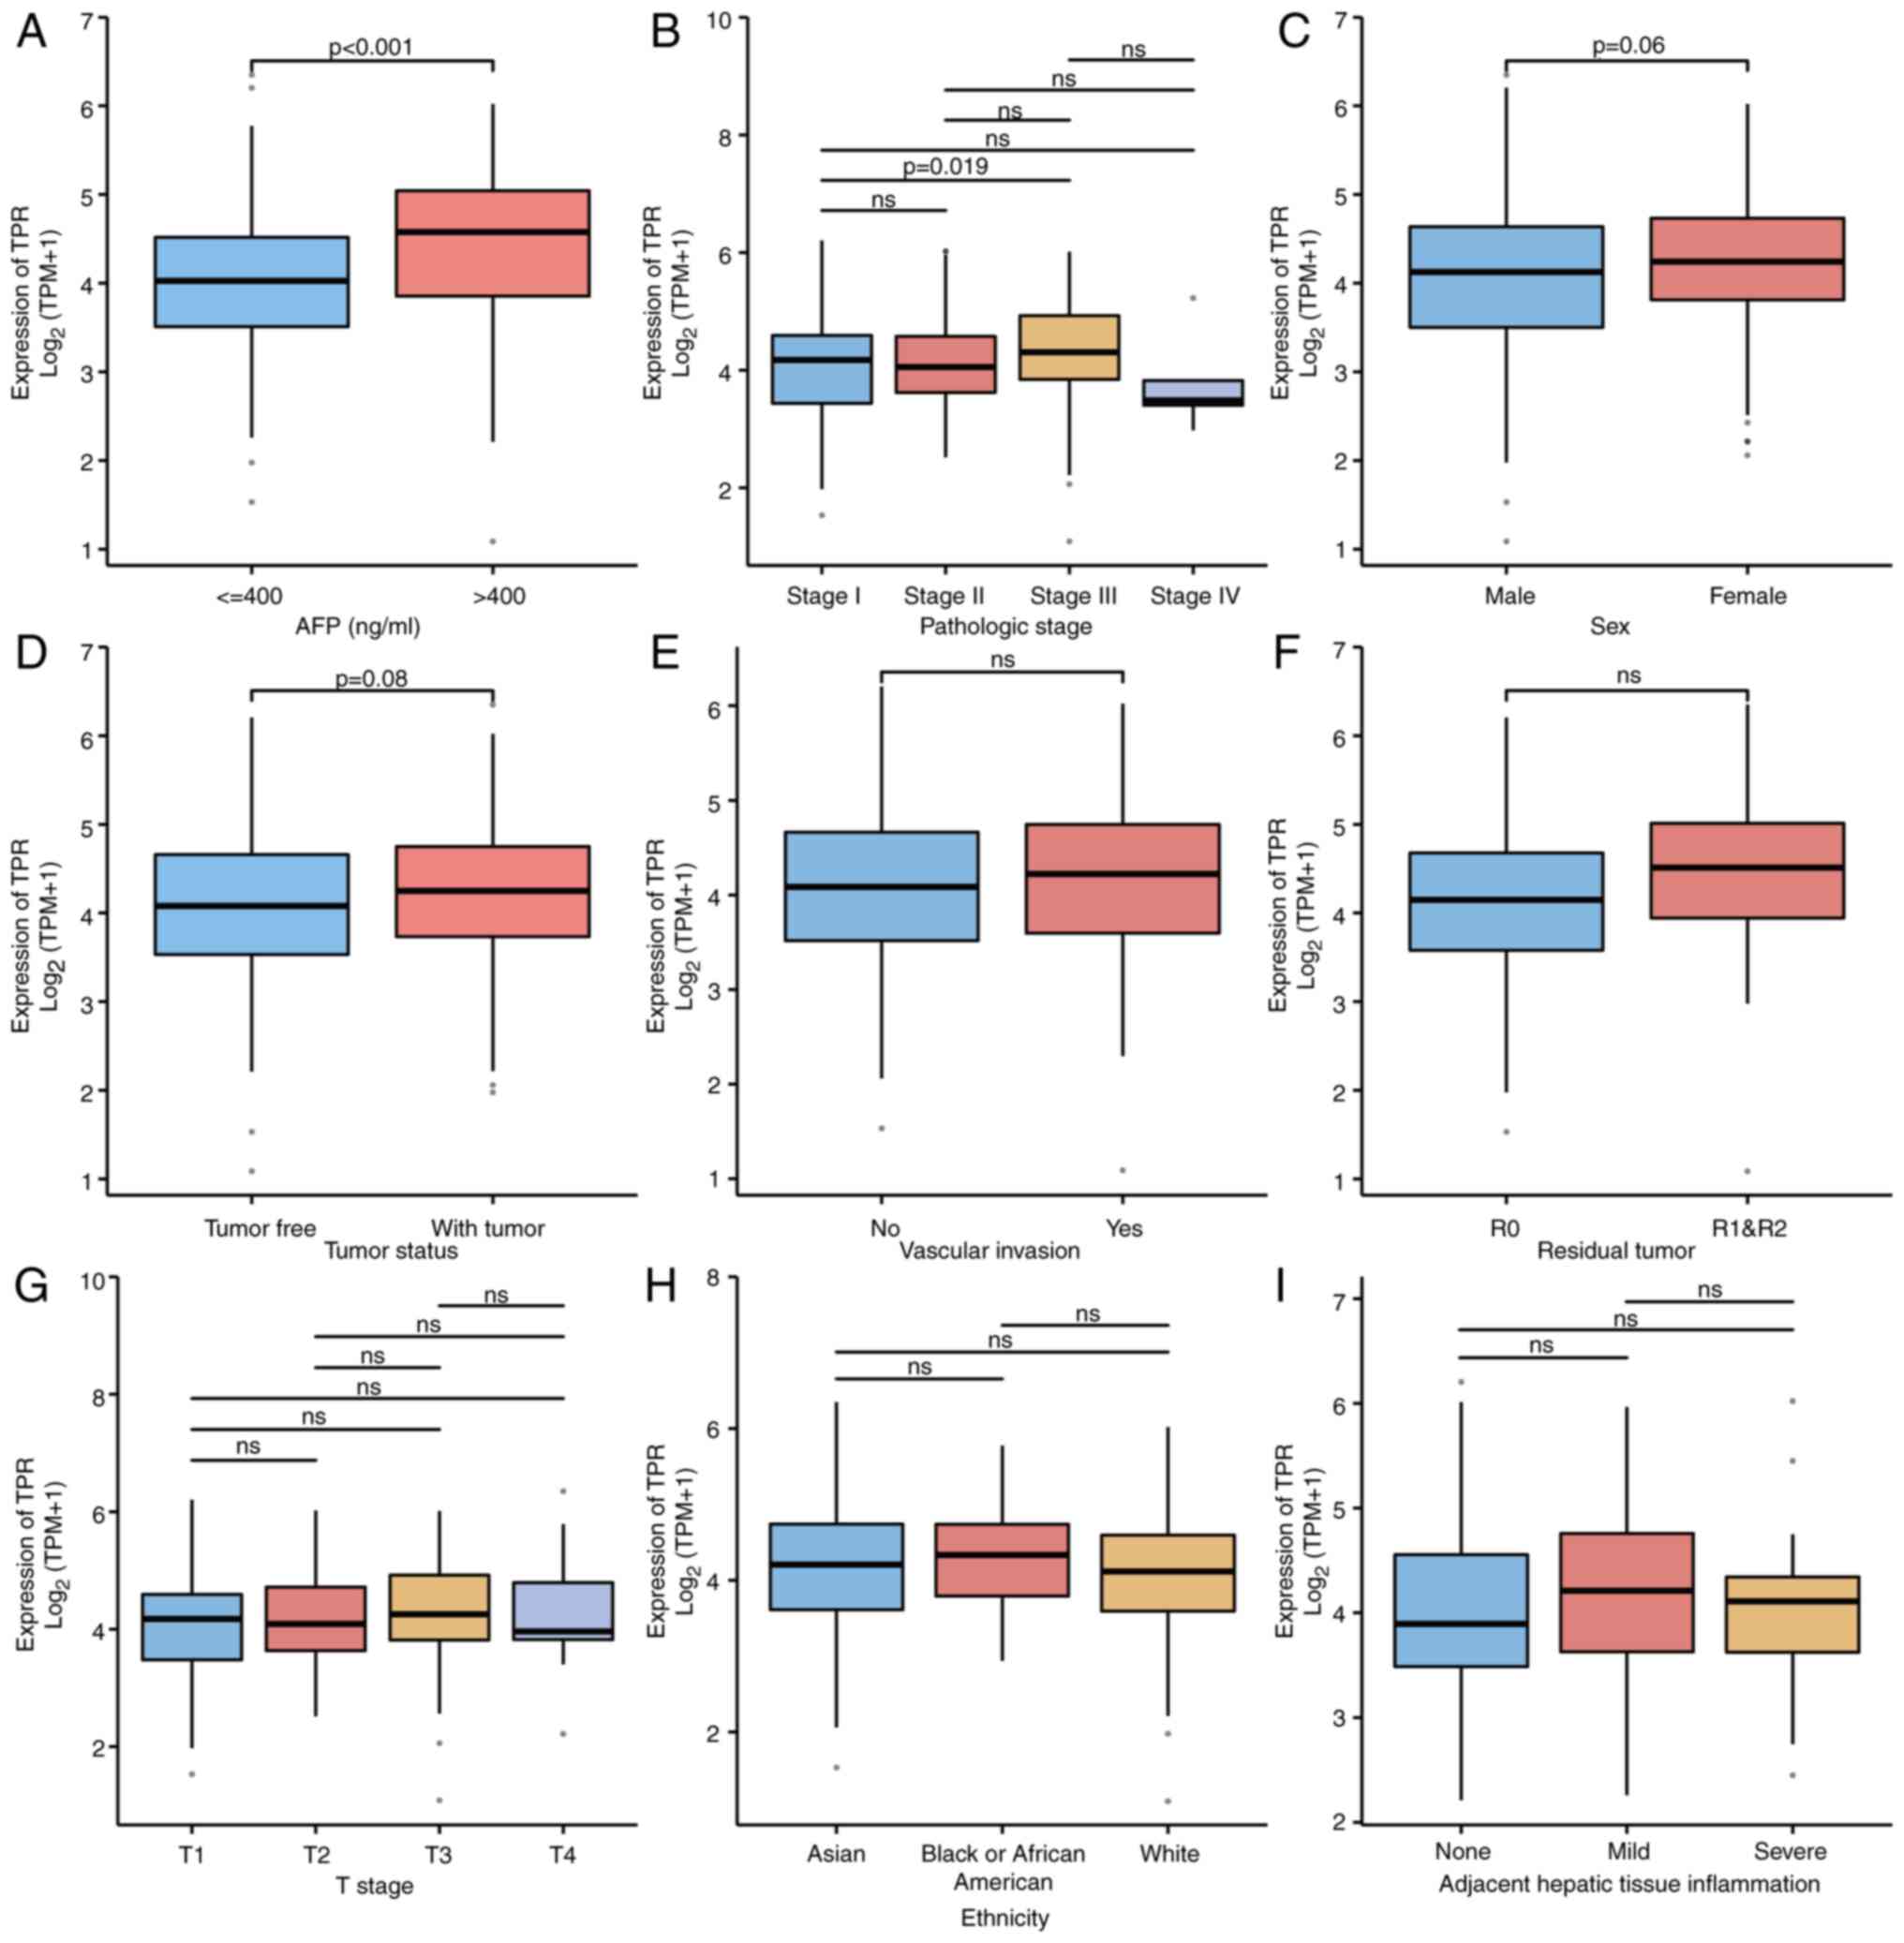
It was then determined whether the expression of TPR is associated with the clinicopathologic variables of patients with HCC. A total of 374 patients with HCC from TCGA, including 353 males and 121 females, were divided into two categories according to the median expression of TPR: The low expression group and the high expression group, and the clinical and gene expression data of these patients were subsequently analyzed (Table SIII). The results revealed that TPR expression was significantly associated with histologic grade (P=0.046), age (P=0.042), height (P=0.039) and weight (P=0.034). An association between TPR expression and other clinicopathologic features was not identified. Based on univariate analyses using logistic regression, it was determined that TPR upregulation in HCC was significantly associated with age (P=0.020), histologic grade (P=0.016) and AFP level (P=0.007) (Table I). As revealed in Fig. 3, TPR expression was significantly associated with AFP (P<0.001) and pathological stage (stage I vs. stage III, P=0.019), but not sex, tumor status, tumor (T) stage, adjacent hepatic tissue inflammation, vascular invasion, residual tumor or ethnicity. These results indicated that the expression of TPR was associated with several clinicopathologic variables of patients with HCC.
Clinical value of TPR in patient prognosis
To evaluate the clinical significance of TPR expression, survival rates between high and low TPR expression levels were compared to determine the association between TPR expression and prognosis. The KM survival analysis demonstrated that there were significant differences in overall survival (OS) relapse-free survival (RFS) and progression-free survival (PFS), between the TPR high and low expression groups (P=0.08; P=0.033; P=0.02, respectively) (Fig. 4A-C). The univariate Cox proportional hazards model was then applied, and T stage, metastasis stage, pathological stage and tumor status were identified as potential prognostic factors with P<0.05 for OS. In addition, after multivariate analyses was applied, the expression of TPR was not identified as an independent risk prognostic factor for OS among patients with HCC (Table II). Based on the risk factors identified in the multivariate analysis, nomograms were developed to predict 1-, 3-5-year OS rates for HCC patients (Fig. 4D). Calibration plots were constructed to evaluate the agreement between the predicted and the actual OS using the prognosis model (Fig. 4E). In addition, the area under curve (AUC) of TPR in HCC was 0.885 (95% CI, 0.852-0.918), which suggested high diagnostic accuracy of TPR in HCC (Fig. 4F). These results indicated that TPR was a valuable marker to predict clinical outcomes, along with other clinical features in patients with HCC.
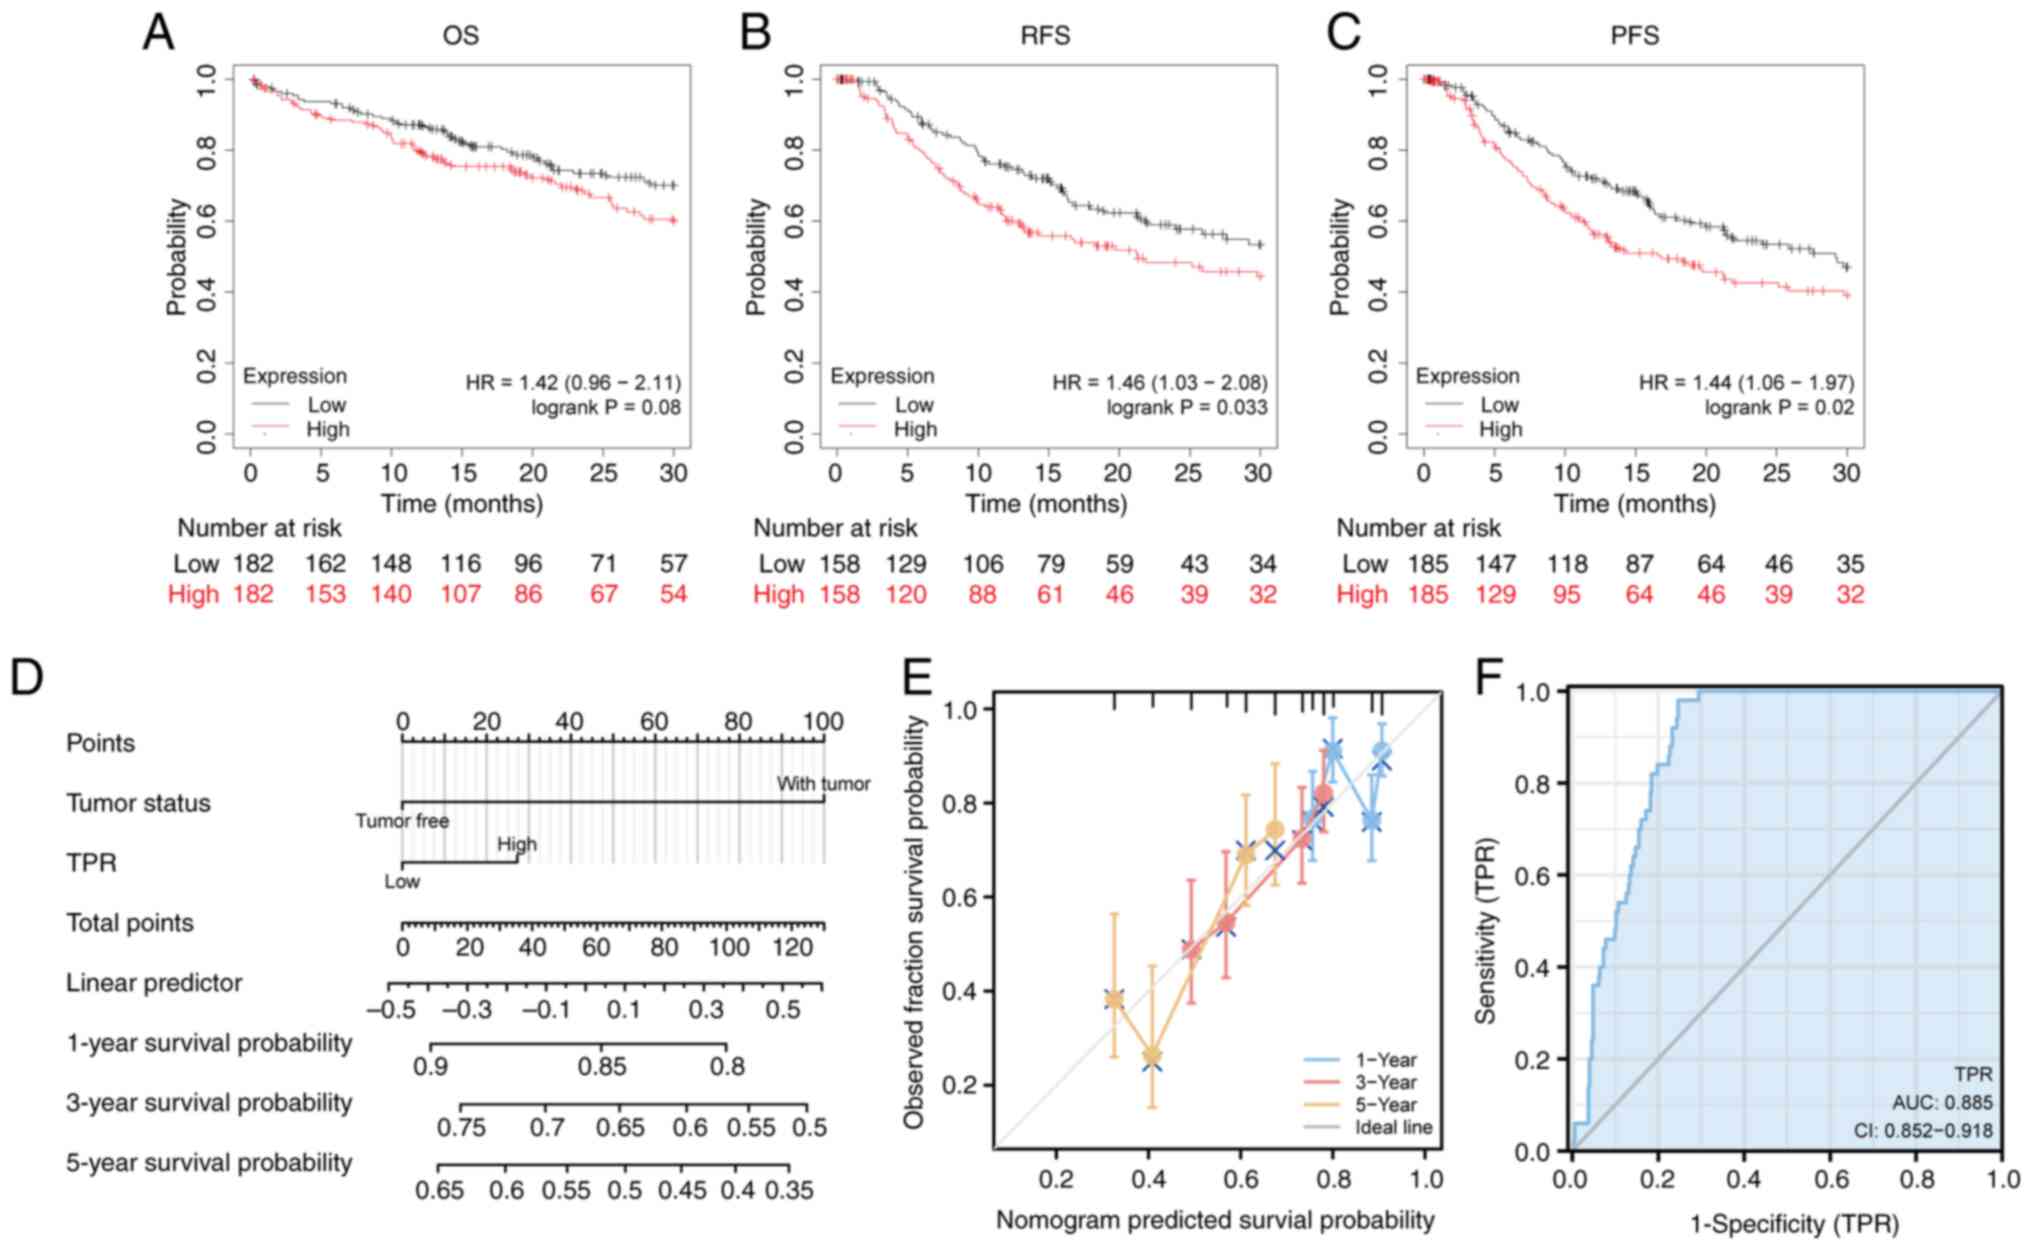
Table IIUnivariate and multivariate analyses of overall survival of patients with hepatocellular carcinoma from The Cancer Genome Atlas (Cox regression). |
DEGs, enrichment and interaction networks analysis
After dividing the patients with HCC into two groups according to their TPR expression, an analysis of the DEGs from the two groups was performed. Based on the analysis, 676 DEGs were identified, among them, 498 genes were upregulated and 169 genes were downregulated (Fig. 5A). The top 10 most downregulated genes were AC107396.1, SAA2, SAA1, HAMP, SAA2-SAA4, CLEC1B, CLEC4G, ACTBP12, AC091729.2 and OR52E8 (data not shown). In addition, the top 10 most upregulated genes (LGALS14, HMGA2, SLC6A14, SLC6A15, MYO3A, FER1L6, BPIFA1, CAPN6, MIR483 and COL2A1) are shown in the gene expression heatmap in Fig. 5B. Notably, HMGA2, which had been demonstrated to be associated with tumor progression (34-36), was the upregulated gene of significant expression according to the volcano plots (Fig. 5A).
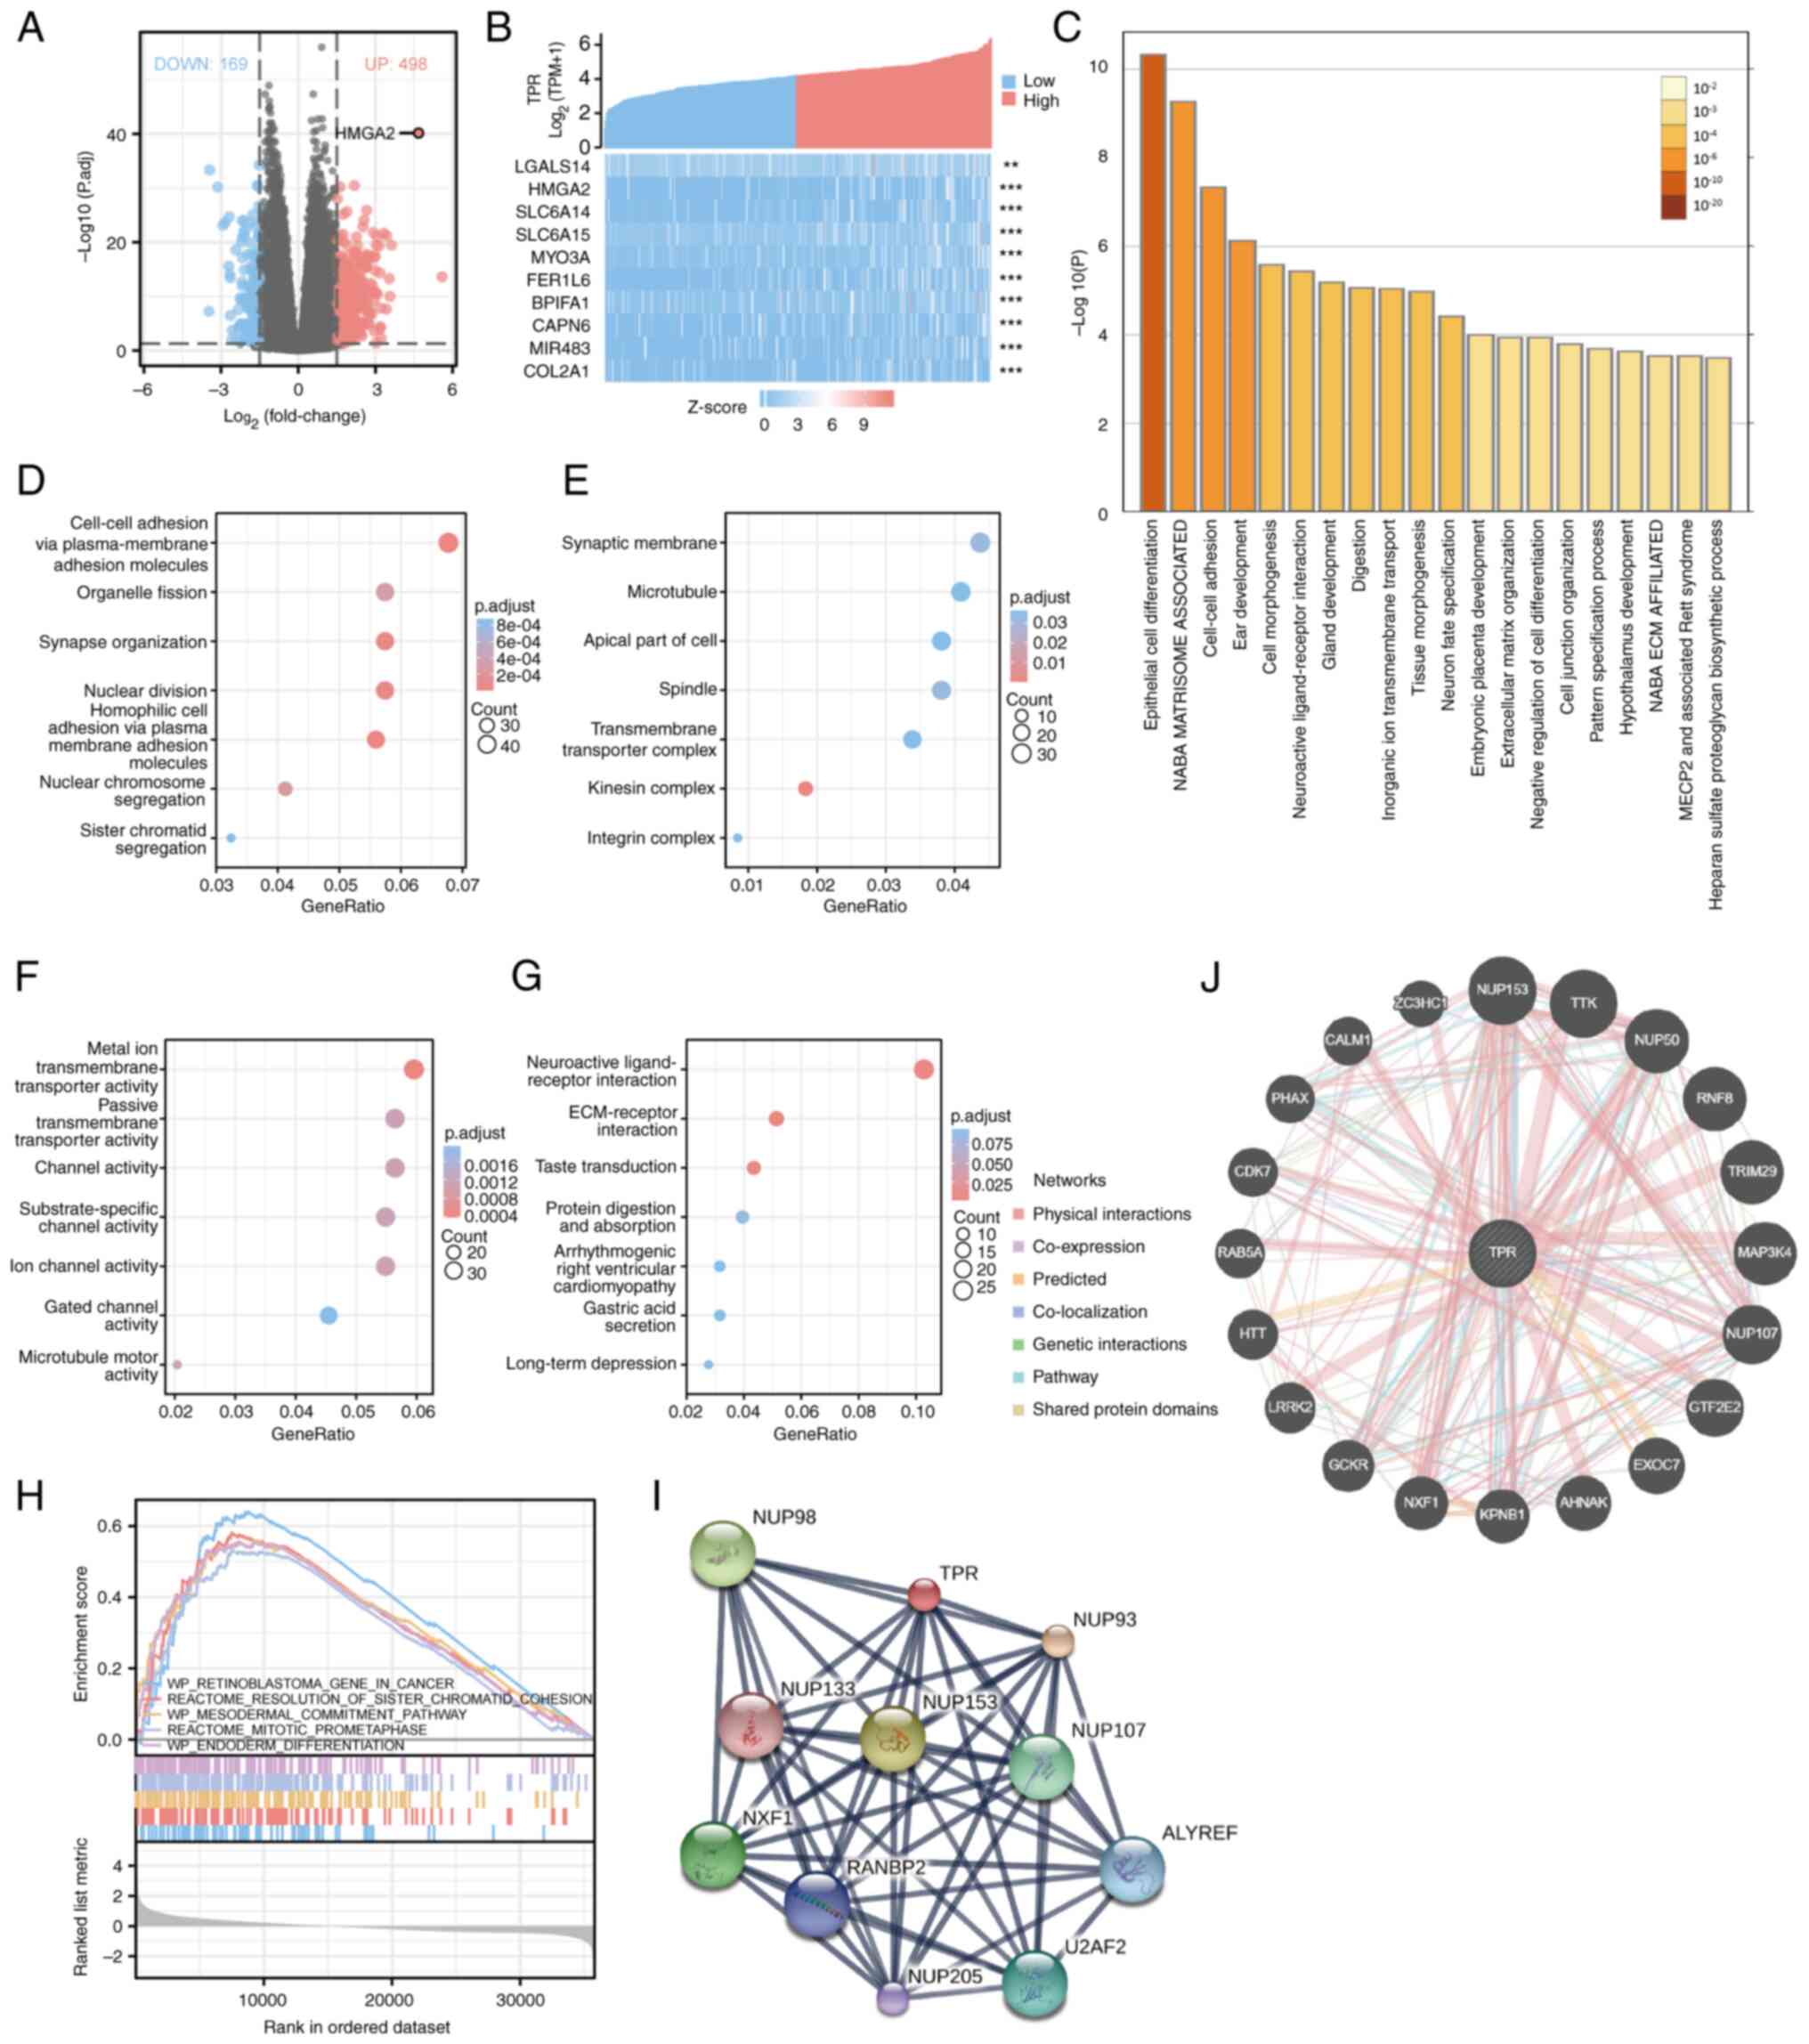
Therefore, the potential biological functions of TPR in HCC were examined. GO and KEGG analyses were performed using the Metascape database, and the top 20 GO enriched pathways are listed in Fig. 5C. It was notable that the GO enriched items included cell differentiation, which is involved in tumor progression. Moreover, a total of 132 BPs, 34 CCs, 37 MFs and 7 KEGG annotations were associated with TPR co-expressed genes, the results of which are shown by bubbly plots (Fig. 5D-G). Next, GSEA between high and low TPR expression data sets were conducted to explore the signaling pathways differentially activated in HCC. Gene sets with false discovery rate (FDR) <0.25 and P.adjust <0.05 were considered as significant. The top five most significant signaling pathways enriched in the high TPR expression phenotype according to their normalized enrichment score (NES) are listed in Fig. 5H, including retinoblastoma gene in cancer (NES=2.801; FDR=0.002; P.adjust=0.003), resolution of sister chromatid cohesion (NES=2.703; FDR=0.002; P.adjust=0.003), mesodermal commitment pathway (NES=2.681; FDR=0.002; P.adjust=0.003), mitotic prometaphase (NES=2.658; FDR=0.002; P.adjust=0.003) and endoderm differentiation (NES=2.650; FDR=0.002; P.adjust=0.003).
Finally, the gene-gene interaction networks of TPR constructed using GeneMania indicated the top 20 most frequently altered genes (Fig. 5I), while the protein-protein interaction networks generated using STITCH presented the top 10 proteins that most interacted with TPR (Fig. 5J; Table III). These results prompted a further investigation into the potential biological functions of TPR in HCC.
Correlation between TPR expression and tumor immune infiltration
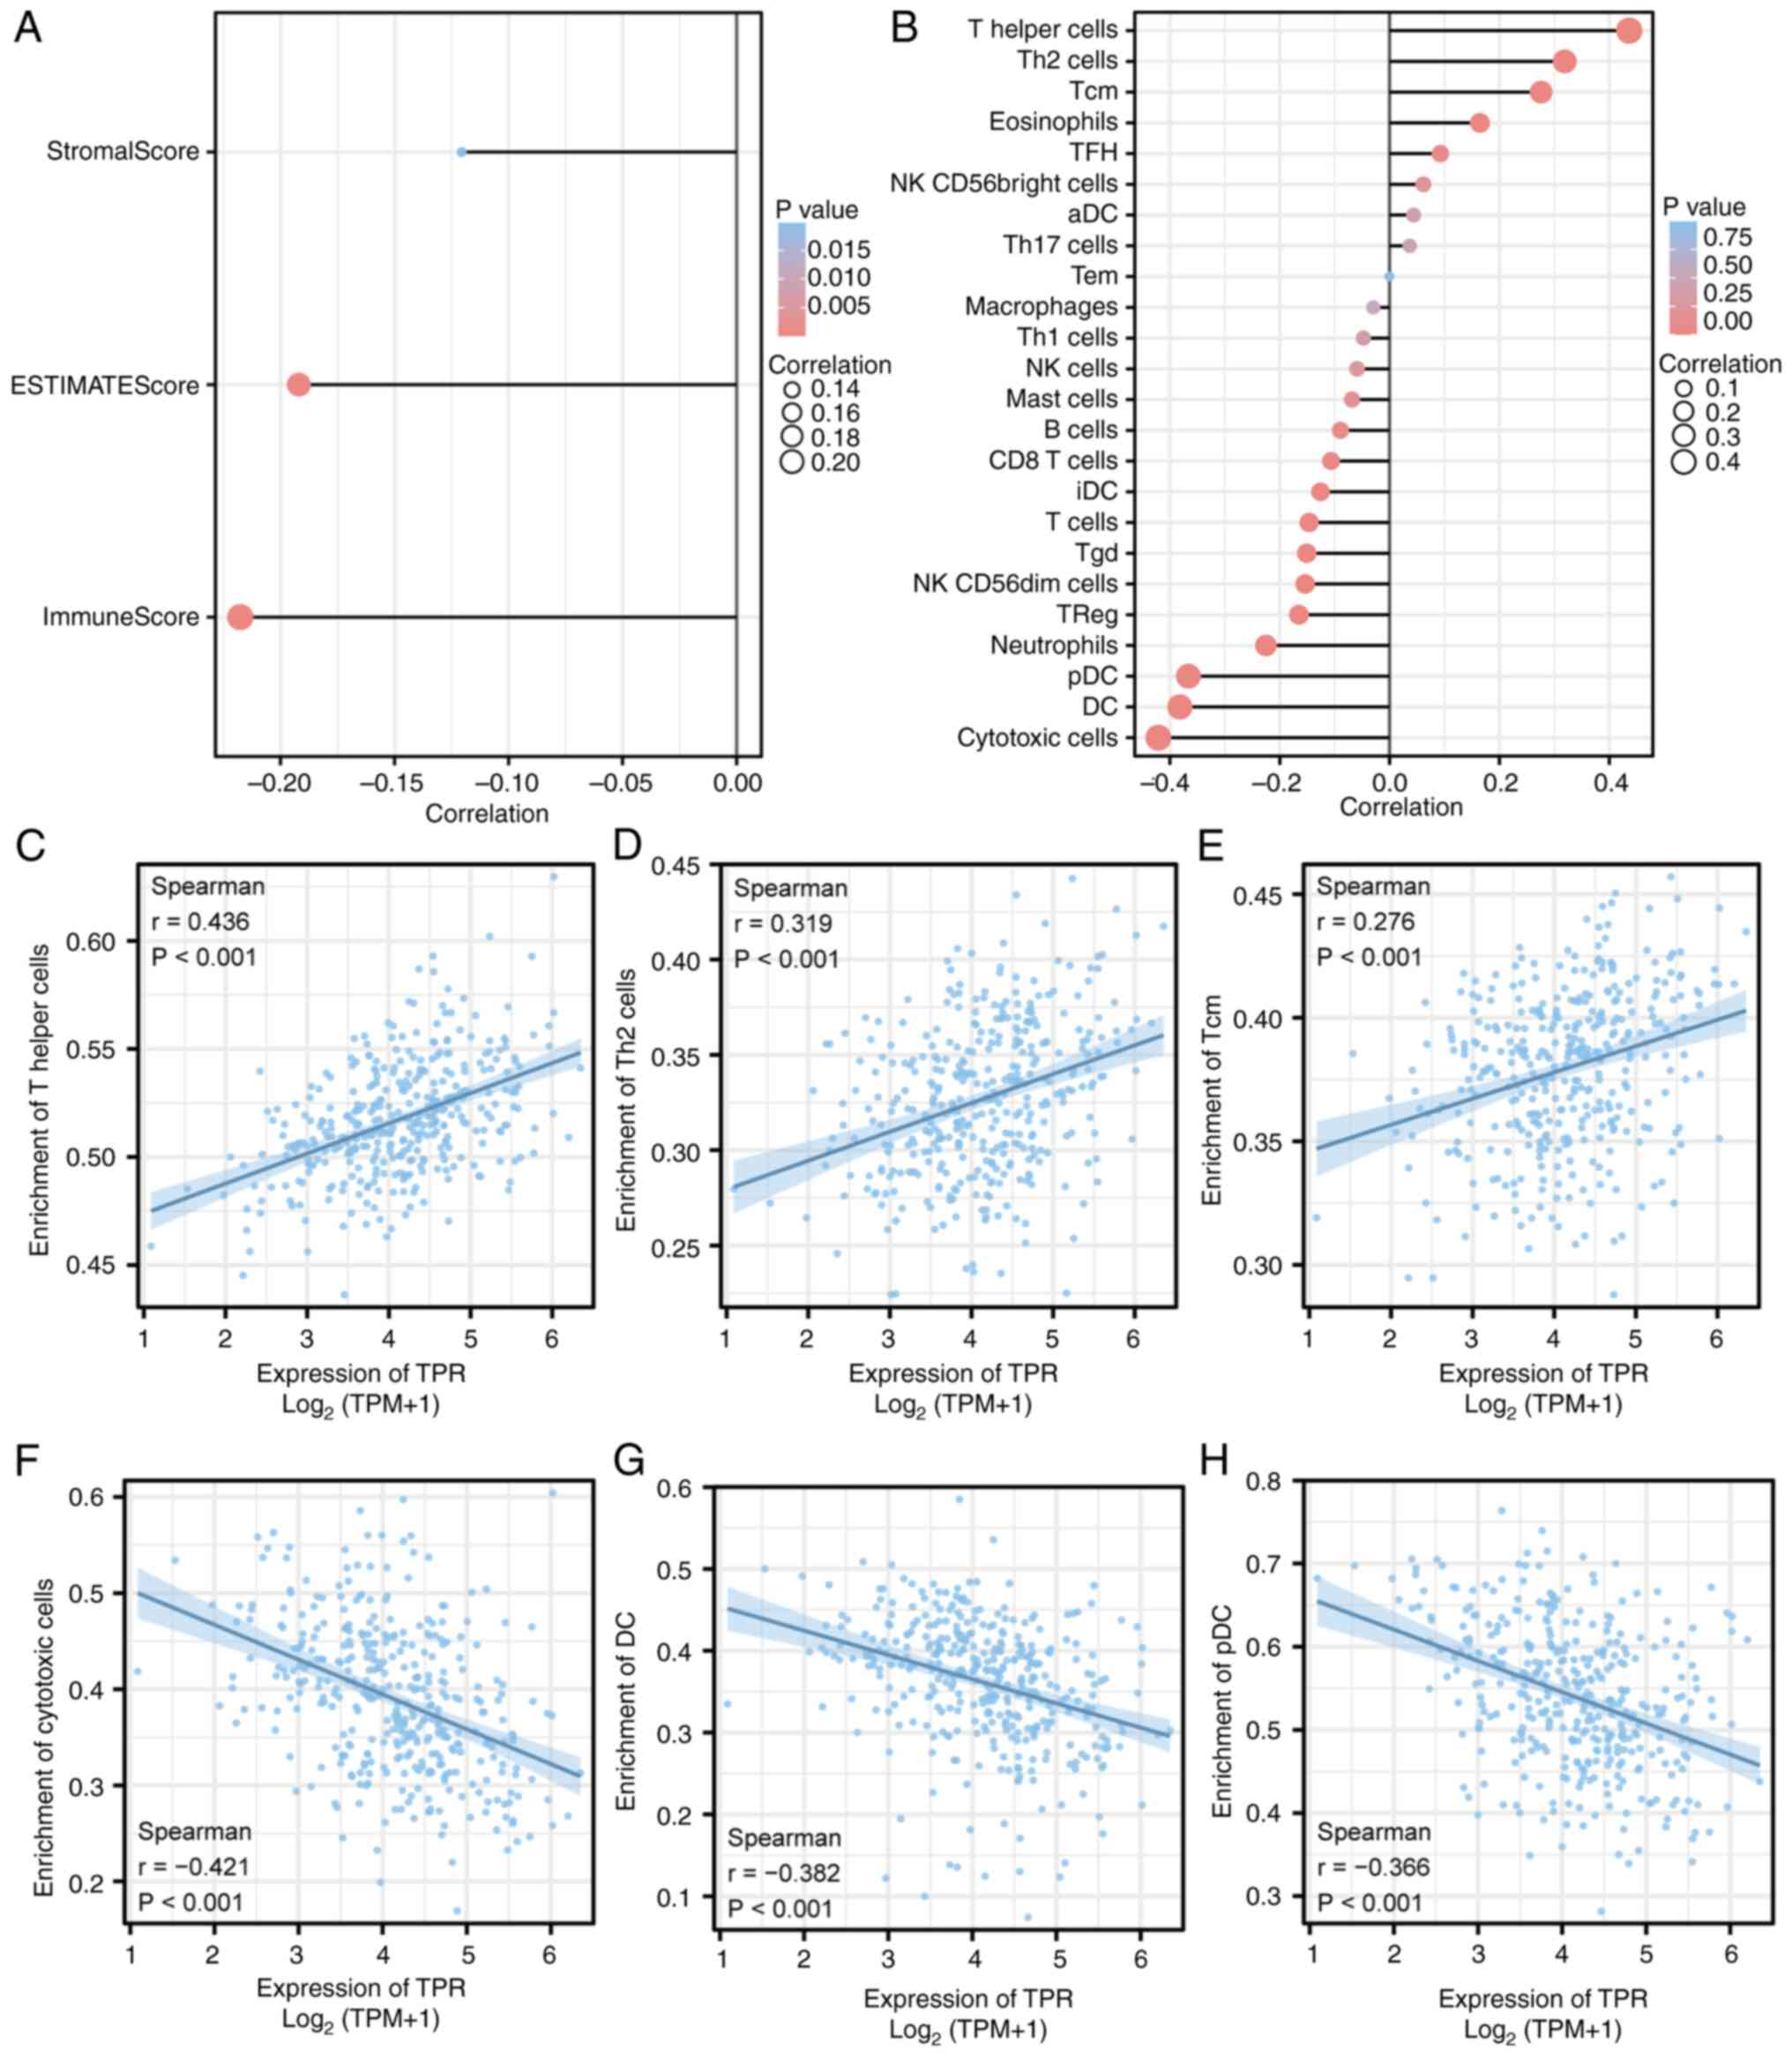
GSEA between high and low TPR expression data sets also identified several immune and inflammation-related pathways enriched in the high TPR expression phenotype, including resistin as a regulator of inflammation, immunoregulatory interactions between a lymphoid and a non-lymphoid cell, the inflammatory response pathway, ADORA2B-mediated anti-inflammatory cytokine production, and intestinal immune network for IgA production (data not shown). Given that targeting the tumor microenvironment (TME) is a new treatment strategy for HCC and that immune infiltration is a core component of the TME, the correlation between TPR and tumor immune infiltration was determined to further investigate the effect of TPR on the TME. For this purpose, the associations between TPR expression and the number of different tumors infiltrating immune cells in HCC were analyzed utilizing the Xiantao tool. The results indicated that the expression of TPR was negatively correlated with StromalScore (ρ=-0.121; P=0.020), ESTIMATEScore (ρ=-0.192; P<0.001) and ImmuneScore (ρ=-0.218; P<0.001) (Fig. 6A). The correlations between TPR and infiltrating immune cells are shown in Fig. 6B. Elevated expression of TPR was positively correlated with the infiltration of T helper cells (ρ=0.436), Th2 cells (ρ=0.319) and central memory T cell (Tcm) (ρ=0.276), and negatively correlated with cytotoxic cells (ρ=0.421), dendritic cells (DCs; ρ=-0.382) and plasmacytoid dendritic cells (pDCs; ρ=-0.366) (all P<0.001) (Fig. 6C-H).
A validation study of TPR expression and the diverse immune signature was further conducted to understand the crosstalk between TPR and immune response by TIMER. The gene markers were used to characterize immune cells (Table IV) and functional T cells (Table V). The results revealed that the expression of TPR was significantly associated with most immune and T cell markers after adjusting for tumor purity. As shown in the aforementioned tables, markers of M1 macrophages (IRF5, PTGS2 and NOS2), M2 macrophages (CD163, VSIG4 and MS4A4A), Treg (FOXP3, CCR8 and TGFB1) and exhausted T cells (HAVCR2, CXCL13 and LAYN) were correlated with TPR in HCC (P<0.001). It was suggested TPR could regulate exhaustion and macrophage polarization in HCC. Next, the association between TPR with immunoinhibitors, such as CSF1R (ρ=-0.285; P<0.001), HAVCR2 (ρ=-0.275; P<0.001) and TGFBR1 (ρ=0.133; P=0.0104) (Fig. 7A), and immunostimulators, including CD40 (ρ=-0.296; P<0.001), IL6R (ρ=0.395; P<0.001) and TNFRSF14 (ρ=-0.388; P<0.001) (Fig. 7B), were investigated. In addition, the association between the expression of TPR and chemokines, containing CCL5 (ρ=0.377; P<0.001), CCL14 (ρ=-0.382; P<0.001) and CXCL2 (ρ=-0.324; P<0.001) (Fig. 7C), were explored. Consistently, TPR expression was identified to be significantly associated with chemokine receptors, such as CCR5 (ρ=-0.181; P<0.001), CXCR3 (ρ=-0.22; P<0.001) and CXCR6 (ρ=-0.238; P<0.001) (Fig. 7D). These results demonstrated that TPR was an immunoregulatory factor in HCC and played an integral role in regulating the immune response.
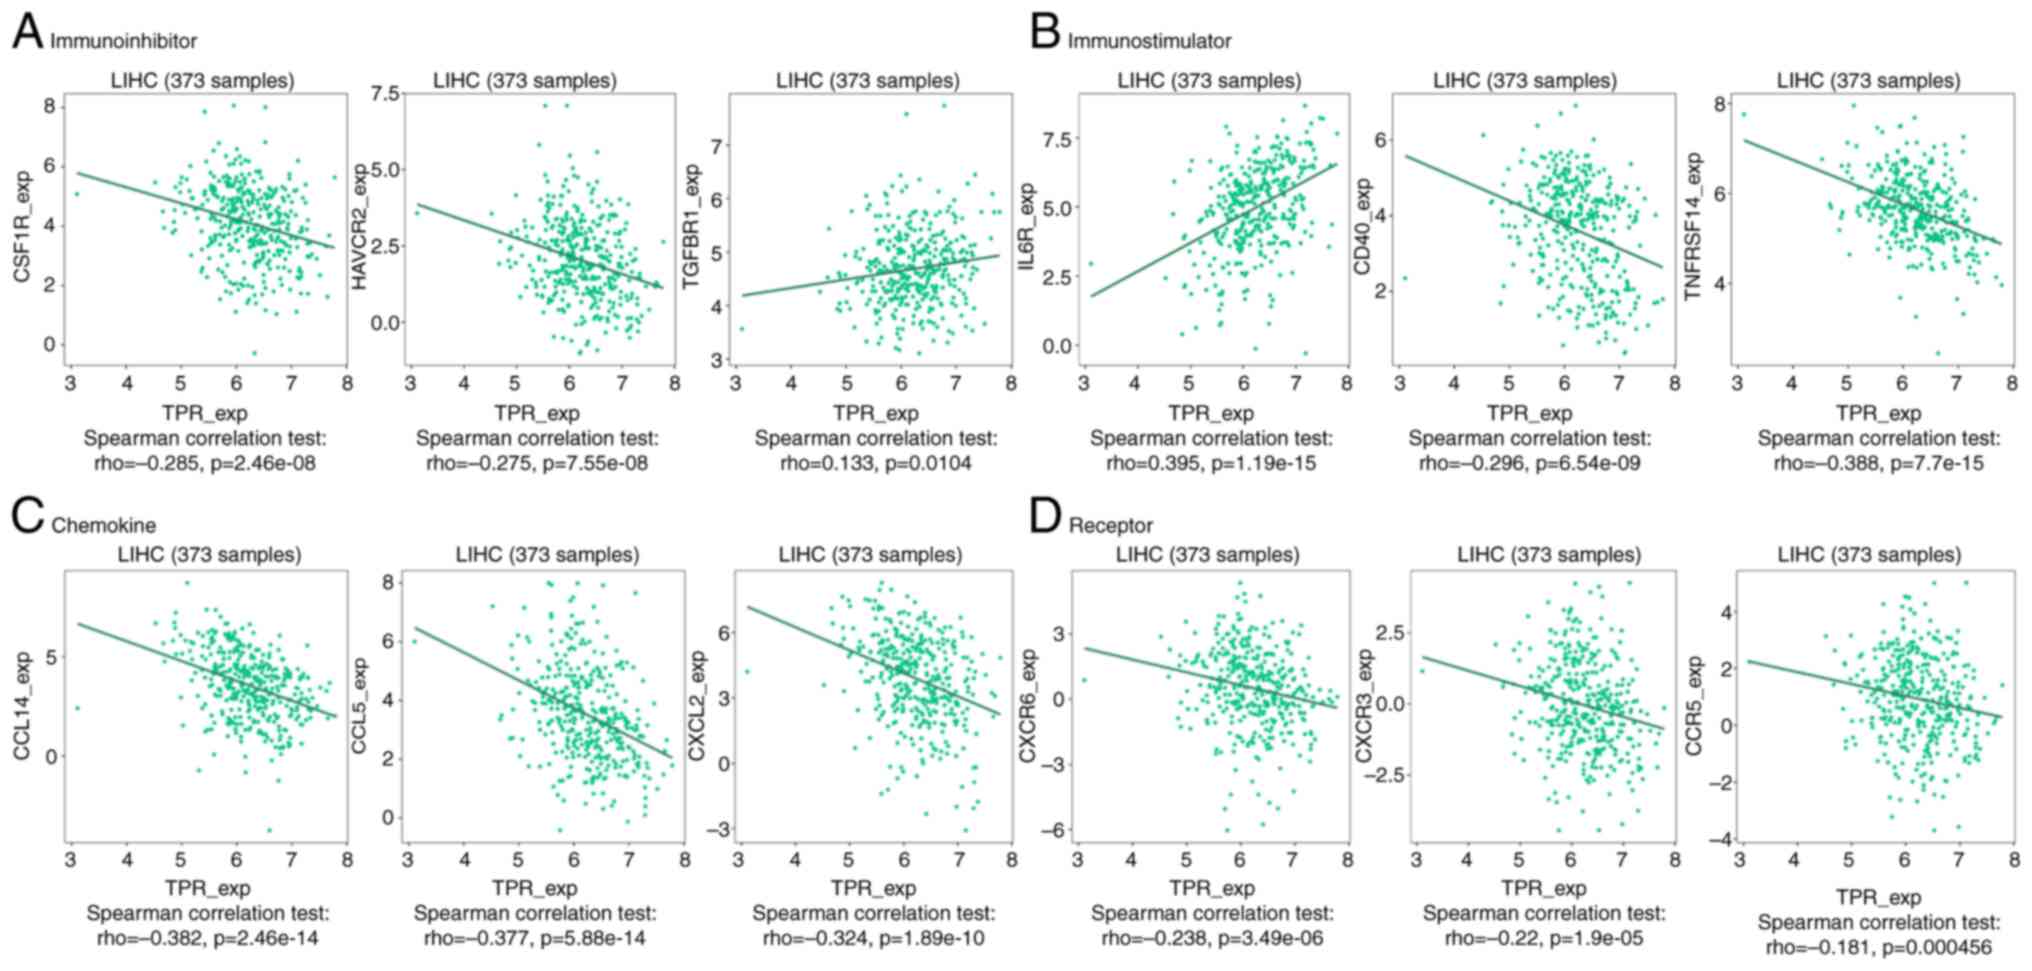
Table VCorrelation analysis between TPR and related gene markers of several types of T cells in TIMER. |
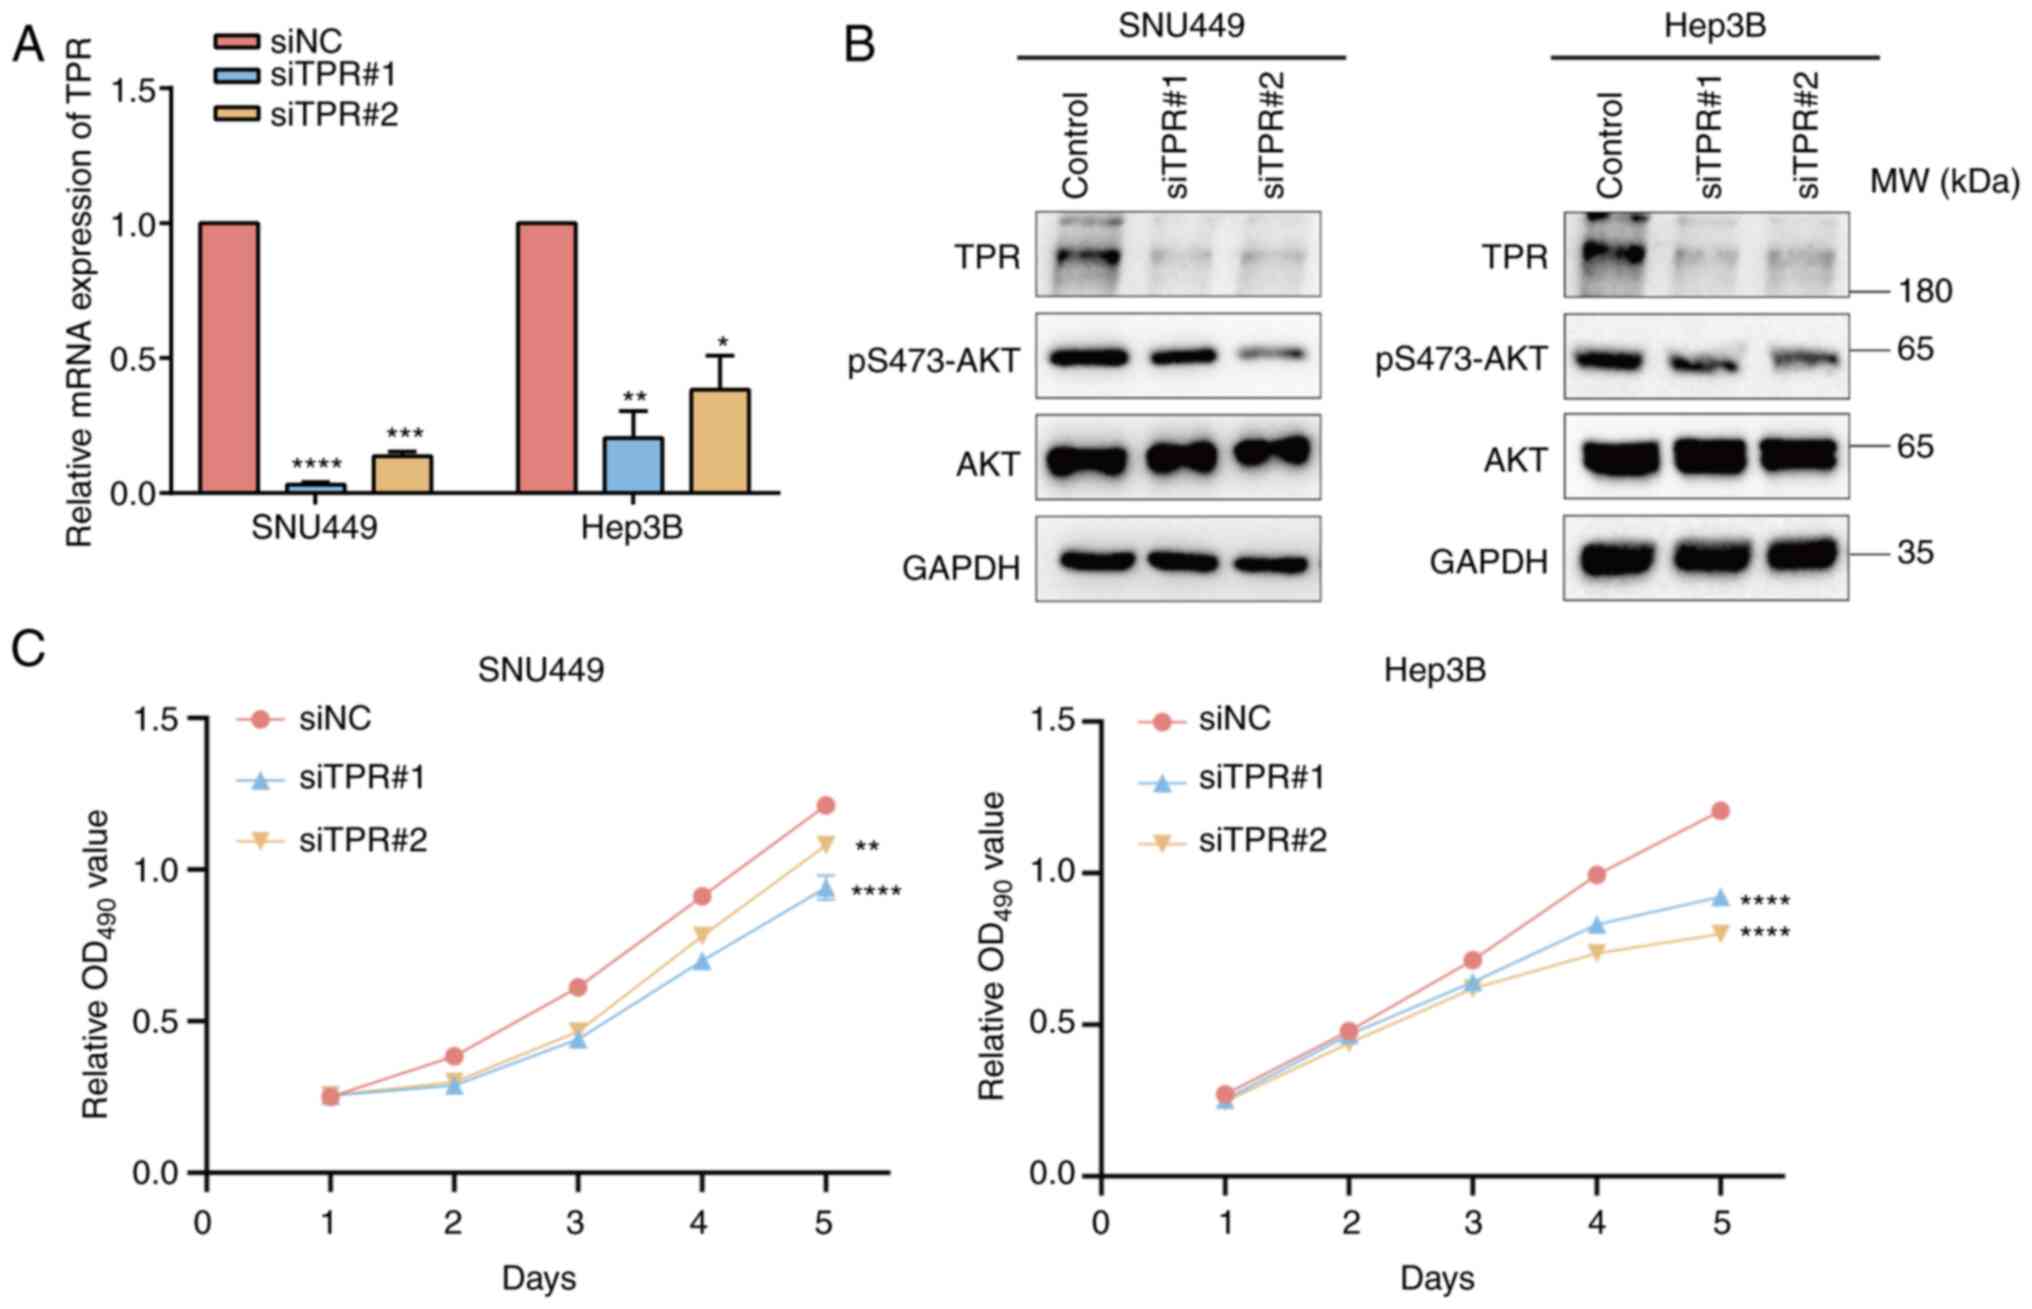
TPR promotes phosphorylation of AKT and proliferation of HCC cells
To confirm the bioinformatics results and to verify the effect of TPR on HCC cells, TPR-silenced SNU449 and Hep3B cell lines were constructed (Fig. 8A). It has been reported that regulation of TPR expression affects the phosphorylation activity of the AKT pathway (37). Consistently, the results of WB demonstrated that silencing TPR expression decreased the phosphorylation levels of AKT (Fig. 8B). Next, an MTT assay was conducted to explore the effect of siTPR on the proliferation ability of HCC cells (Fig. 8C). The results demonstrated that after silencing TPR in SNU449 and Hep3B cells, proliferation was significantly inhibited. Therefore, TPR may promote the proliferation of HCC cells through the AKT pathway.
Discussion
In the present study, the expression level of TPR in HCC and the clinical significance of the gene was comprehensively evaluated by bioinformatics methods. It was demonstrated that high expression of TPR in HCC was associated with poor prognosis. In addition, expression of TPR was closely associated with the infiltration of various immune cells, immunomodulators and chemokines. Collectively, these results offer new insights into the roles TPR plays in HCC, which may have a prognostic value for tumor immune infiltration.
Studies have demonstrated that TPR is involved in several types of cancer. For instance, Wei et al (19) suggested that the role of a novel TPR-ROS1 fusion was as an oncogenic driver in metastatic non-small cell lung cancer (NSCLC); Choi et al (20) reported that the TRP-ALK protein had the potential to transform cells and respond to ALK inhibitor treatment in NSCLC; Dewi et al (21) reported that TPR regulated heat shock transcription factor 1 mRNA trafficking, maintained MTORC1 activity to phosphorylate ULK1, and prevented macroautophagy/autophagy induction in ependymoma. According to these studies, TPR may affect cancer in a significant way and several types of malignancies may be treated by targeting it. However, it is unclear whether TPR has clinical significance in HCC or whether it regulates tumor immunity.
In the present study, according to bioinformatic analyses of high throughput RNA-sequencing data from TCGA, TPR was expressed at a significantly higher level in HCC tissues than in paired normal tissues, indicating that TPR participated in tumorigenesis and progression. Further investigation was conducted into the link between TPR expression and clinicopathological parameters and it was identified that high expression levels of TPR protein were associated with AFP and pathological stage. In addition, a prognostic gene signature model based on the KM curve of TPR demonstrated that TPR is valuable for predicting HCC survival, and there was a decrease in OS, RFS and PFS in patients with HCC with higher TPR expression. Additionally, it was suggested that the expression level of TPR could be used as a diagnostic indicator of HCC with an AUC of 0.885. Taken together, these results support the hypothesis that TPR could be a prognostic biomarker for HCC.
In addition, valuable insight into the potential key pathways of TPR in HCC were provided in the present study. Metascape revealed that cell differentiation was included in the enriched terms. Consistently, GSEA also demonstrated that differentiation was enriched in the TPR high expression phenotype. There is evidence that cancer pathogenesis is driven by evading or escaping from terminal differentiation after unlocking the normally restricted capability for phenotypic plasticity (38). Thus, cell plasticity is a promising target for anticancer therapy. The potential connection between TPR and cell differentiation may be a differentiation therapeutic target in HCC.
A significant correlation between TPR expression and immune infiltration in HCC was also demonstrated in the present study. It was determined that TPR was positively correlated to T helper cells, Th2 cells and Tcm, whereas TPR had an inverse correlation with cytotoxic cells, DC and pDC. Furthermore, TPR was significantly correlated with several immune cell marker sets. For instance, TPR expression was associated with markers of M1 macrophages, IRF5, PTGS2 and NOS2, as well as markers of M2 macrophages, CD163, VSIG4 and MS4A4A. There is an important role for macrophages in proliferation (39), angiogenesis (40), invasion and metastasis (41). According to these results, TPR may regulate polarization of tumor-associated macrophages. In addition, TPR upregulation was also closely associated with Treg markers (FOXP3, CCR8 and TGFB1) and exhausted T cells markers (HAVCR2, LAG3, CXCL13 and LAYN). The main strategy of immunotherapy is to block immune checkpoints (42). Therefore, it is essential to increase the response of tumor cells to immune checkpoint inhibitors and cytokines (43,44). Given that the upregulation of TPR was significantly correlated with immune regulators and chemokines, it is proposed that targeting TPR may improve immunotherapy effectiveness.
Furthermore, in the present study, it was demonstrated that TPR regulated the AKT signaling pathway and tumorigenicity. TPR silencing decreased the phosphorylation levels of AKT and the proliferation of HCC cells. Recently, studies have demonstrated that the AKT pathway regulates cell proliferation and survival (45,46). Consistently, the AKT pathway has been revealed to be hyperactivated in HCC (47). The aforementioned results suggest that acceleration of the malignant behaviors of HCC cells by TPR may be through activating the AKT pathway, although the exact mechanism requires further investigation.
In spite of these results, the present study has some limitations. The results of the present study may be influenced by the fact that most of the data is based on online platforms, which are continuously updated and extended. In addition, the clinical background of these patients is unclear and there may be data collection bias. To avoid confounding differences in the clinical outcomes due to the tumor burdens with those stemming from baseline differences, future research will pay more attention to background information from patients. Secondly, the specific mechanism by which TPR regulates the AKT pathway and other pathways related to TPR in HCC need to be further explored in future studies.
Supplementary Material
Venn diagram of identified downregulated differentially expressed genesin three gene expression profile datasets.
Primers used to amplify the indicated genes.
Antibodies used in western blotting
Association between the expression of TPR and the clinicopathological characteristics of patients
Acknowledgements
Not applicable.
Funding
Funding: No funding was received.
Availability of data and materials
The datasets used and/or analyzed during the current study are available from the corresponding author on reasonable request.
Authors' contributions
TL, WW, XW and MC contributed to the conception and design of the study. TL and WW were responsible for the analysis and interpretation of the data. TL and WW drafted the manuscript. XW and MC revised the manuscript critically for intellectual content. TL, WW, XW and MC confirm the authenticity of all the raw data. All authors read and approved the final version of the manuscript.
Ethics approval and consent to participate
The present study was conducted according to the ethical guidelines of the 1975 Declaration of Helsinki. The study was approved (approval no. B2022-238-02) by the Research Medical Ethics Committee of Sun Yat-sen University Cancer Center (Guangzhou, China). Informed consent was obtained from all patients.
Patient consent for publication
All patients signed the informed consent for second use of pathological data and biological specimens.
Competing interests
The authors declare that they have no competing interests.
References
|
Bray F, Ferlay J, Soerjomataram I, Siegel RL, Torre LA and Jemal A: Global cancer statistics 2018: GLOBOCAN estimates of incidence and mortality worldwide for 36 cancers in 185 countries. CA Cancer J Clin. 68:394–424. 2018.PubMed/NCBI View Article : Google Scholar | |
|
Sung H, Ferlay J, Siegel RL, Laversanne M, Soerjomataram I, Jemal A and Bray F: Global cancer statistics 2020: GLOBOCAN estimates of incidence and mortality worldwide for 36 cancers in 185 countries. CA Cancer J Clin. 71:209–49. 2021.PubMed/NCBI View Article : Google Scholar | |
|
European Association for the Study of the Liver. Electronic address: easloffice@easloffice.eu; European Association for the Study of the Liver. EASL clinical practice guidelines: Management of hepatocellular carcinoma. J Hepatol. 69:182–236. 2018.PubMed/NCBI View Article : Google Scholar | |
|
Kulik L and El-Serag HB: Epidemiology and management of hepatocellular carcinoma. Gastroenterology. 156:477–491.e1. 2019.PubMed/NCBI View Article : Google Scholar | |
|
Chaiteerakij R, Addissie BD and Roberts LR: Update on biomarkers of hepatocellular carcinoma. Clin Gastroenterol Hepatol. 13:237–245. 2015.PubMed/NCBI View Article : Google Scholar | |
|
Byrd DA, Sweet DJ, Pante N, Konstantinov KN, Guan T, Saphire AC, Mitchell PJ, Cooper CS, Aebi U and Gerace L: Tpr, a large coiled coil protein whose amino terminus is involved in activation of oncogenic kinases, is localized to the cytoplasmic surface of the nuclear pore complex. J Cell Biol. 127:1515–1526. 1994.PubMed/NCBI View Article : Google Scholar | |
|
Cordes VC, Reidenbach S, Rackwitz HR and Franke WW: Identification of protein p270/Tpr as a constitutive component of the nuclear pore complex-attached intranuclear filaments. J Cell Biol. 136:515–529. 1997.PubMed/NCBI View Article : Google Scholar | |
|
Bangs P, Burke B, Powers C, Craig R, Purohit A and Doxsey S: Functional analysis of Tpr: Identification of nuclear pore complex association and nuclear localization domains and a role in mRNA export. J Cell Biol. 143:1801–1812. 1998.PubMed/NCBI View Article : Google Scholar | |
|
Cordes VC, Hase ME and Muller L: Molecular segments of protein Tpr that confer nuclear targeting and association with the nuclear pore complex. Exp Cell Res. 245:43–56. 1998.PubMed/NCBI View Article : Google Scholar | |
|
Hase ME, Kuznetsov NV and Cordes VC: Amino acid substitutions of coiled-coil protein Tpr abrogate anchorage to the nuclear pore complex but not parallel, in-register homodimerization. Mol Biol Cell. 12:2433–2452. 2001.PubMed/NCBI View Article : Google Scholar | |
|
Frosst P, Guan T, Subauste C, Hahn K and Gerace L: Tpr is localized within the nuclear basket of the pore complex and has a role in nuclear protein export. J Cell Biol. 156:617–630. 2002.PubMed/NCBI View Article : Google Scholar | |
|
Fontoura BM, Dales S, Blobel G and Zhong H: The nucleoporin Nup98 associates with the intranuclear filamentous protein network of TPR. Proc Natl Acad Sci USA. 98:3208–3213. 2001.PubMed/NCBI View Article : Google Scholar | |
|
Agarwal S, Yadav SK and Dixit A: Heterologous expression of translocated promoter region protein, Tpr, identified as a transcription factor from Rattus norvegicus. Protein Expr Purif. 77:112–117. 2011.PubMed/NCBI View Article : Google Scholar | |
|
Krull S, Dörries J, Boysen B, Reidenbach S, Magnius L, Norder H, Thyberg J and Cordes VC: Protein Tpr is required for establishing nuclear pore-associated zones of heterochromatin exclusion. EMBO J. 29:1659–1673. 2010.PubMed/NCBI View Article : Google Scholar | |
|
Aksenova V, Smith A, Lee H, Bhat P, Esnault C, Chen S, Iben J, Kaufhold R, Yau KC, Echeverria C, et al: Nucleoporin TPR is an integral component of the TREX-2 mRNA export pathway. Nat Commun. 11(4577)2020.PubMed/NCBI View Article : Google Scholar | |
|
Lee ES, Wolf EJ, Ihn SSJ, Smith HW, Emili A and Palazzo AF: TPR is required for the efficient nuclear export of mRNAs and lncRNAs from short and intron-poor genes. Nucleic Acids Res. 48:11645–11663. 2020.PubMed/NCBI View Article : Google Scholar | |
|
Vomastek T, Iwanicki MP, Burack WR, Tiwari D, Kumar D, Parsons JT, Weber MJ and Nandicoori VK: Extracellular signal-regulated kinase 2 (ERK2) phosphorylation sites and docking domain on the nuclear pore complex protein Tpr cooperatively regulate ERK2-Tpr interaction. Mol Cell Biol. 28:6954–6966. 2008.PubMed/NCBI View Article : Google Scholar | |
|
Su Y, Pelz C, Huang T, Torkenczy K, Wang X, Cherry A, Daniel CJ, Liang J, Nan X, Dai MS, et al: Post-translational modification localizes MYC to the nuclear pore basket to regulate a subset of target genes involved in cellular responses to environmental signals. Genes Dev. 32:1398–1419. 2018.PubMed/NCBI View Article : Google Scholar | |
|
Wei S, Hu M, Yang Y, Huang X, Li B, Ding L and Wang P: Case report: Short-term response to first-line crizotinib monotherapy in a metastatic lung adenocarcinoma patient harboring a novel TPR-ROS1 fusion. Front Oncol. 12(862008)2022.PubMed/NCBI View Article : Google Scholar | |
|
Choi YL, Lira ME, Hong M, Kim RN, Choi SJ, Song JY, Pandy K, Mann DL, Stahl JA, Peckham HE, et al: A novel fusion of TPR and ALK in lung adenocarcinoma. J Thorac Oncol. 9:563–566. 2014.PubMed/NCBI View Article : Google Scholar | |
|
Dewi FRP, Jiapaer S, Kobayashi A, Hazawa M, Ikliptikawati DK, Hartono Sabit H, Nakada M and Wong RW: Nucleoporin TPR (translocated promoter region, nuclear basket protein) upregulation alters MTOR-HSF1 trails and suppresses autophagy induction in ependymoma. Autophagy. 17:1001–1012. 2021.PubMed/NCBI View Article : Google Scholar | |
|
Deland L, Keane S, Bontell TO, Fagman H, Sjögren H, Lind AE, Carén H, Tisell M, Nilsson JA, Ejeskär K, et al: Novel TPR::ROS1 fusion gene activates MAPK, PI3K and JAK/STAT signaling in an infant-type pediatric glioma. Cancer Genomics Proteomics. 19:711–726. 2022.PubMed/NCBI View Article : Google Scholar | |
|
Moon SW, Mo HY, Choi EJ, Yoo NJ and Lee SH: Cancer-related SRCAP and TPR mutations in colon cancers. Pathol Res Pract. 217(153292)2021.PubMed/NCBI View Article : Google Scholar | |
|
Lim HY, Sohn I, Deng S, Lee J, Jung SH, Mao M, Xu J, Wang K, Shi S, Joh JW, et al: Prediction of disease-free survival in hepatocellular carcinoma by gene expression profiling. Ann Surg Oncol. 20:3747–3753. 2013.PubMed/NCBI View Article : Google Scholar | |
|
Kim JH, Sohn BH, Lee HS, Kim SB, Yoo JE, Park YY, Jeong W, Lee SS, Park ES, Kaseb A, et al: Genomic predictors for recurrence patterns of hepatocellular carcinoma: Model derivation and validation. PLoS Med. 11(e1001770)2014.PubMed/NCBI View Article : Google Scholar | |
|
Wang YH, Cheng TY, Chen TY, Chang KM, Chuang VP and Kao KJ: Plasmalemmal vesicle associated protein (PLVAP) as a therapeutic target for treatment of hepatocellular carcinoma. BMC Cancer. 14(815)2014.PubMed/NCBI View Article : Google Scholar | |
|
Knapek KJ, Georges HM, Van Campen H, Bishop JV, Bielefeldt-Ohmann H, Smirnova NP and Hansen TR: Fetal lymphoid organ immune responses to transient and persistent infection with bovine viral diarrhea virus. Viruses. 12(816)2020.PubMed/NCBI View Article : Google Scholar | |
|
Wang S, Yao X, Ma S, Ping Y, Fan Y, Sun S, He Z, Shi Y, Sun L, Xiao S, et al: A single-cell transcriptomic landscape of the lungs of patients with COVID-19. Nat Cell Biol. 23:1314–1328. 2021.PubMed/NCBI View Article : Google Scholar | |
|
Zhu Y, Chen M, Xu D, Li TE, Zhang Z, Li JH, Wang XY, Yang X, Lu L, Jia HL, et al: The combination of PD-1 blockade with interferon-α has a synergistic effect on hepatocellular carcinoma. Cell Mol Immunol. 19:726–737. 2022.PubMed/NCBI View Article : Google Scholar | |
|
Han H, Lin T, Wang Z, Song J, Fang Z, Zhang J, You X, Du Y, Ye J and Zhou G: RNA-binding motif 4 promotes angiogenesis in HCC by selectively activating VEGF-A expression. Pharmacol Res. 187(106593)2022.PubMed/NCBI View Article : Google Scholar | |
|
Yi C, Chen L, Lin Z, Liu L, Shao W, Zhang R, Lin J, Zhang J, Zhu W, Jia H, et al: Lenvatinib targets FGF receptor 4 to enhance antitumor immune response of anti-programmed cell death-1 in HCC. Hepatology. 74:2544–2560. 2021.PubMed/NCBI View Article : Google Scholar | |
|
Xiao Z, Wang Y and Ding H: XPD suppresses cell proliferation and migration via miR-29a-3p-Mdm2/PDGF-B axis in HCC. Cell Biosci. 9(6)2019.PubMed/NCBI View Article : Google Scholar | |
|
Kalathil SG, Wang K, Hutson A, Iyer R and Thanavala Y: Tivozanib mediated inhibition of c-Kit/SCF signaling on Tregs and MDSCs and reversal of tumor induced immune suppression correlates with survival of HCC patients. Oncoimmunology. 9(1824863)2020.PubMed/NCBI View Article : Google Scholar | |
|
Li DK, Chen XR, Wang LN, Wang JH, Li JK, Zhou ZY, Li X, Cai LB, Zhong SS, Zhang JJ, et al: Exosomal HMGA2 protein from EBV-positive NPC cells destroys vascular endothelial barriers and induces endothelial-to-mesenchymal transition to promote metastasis. Cancer Gene Ther. 29:1439–1451. 2022.PubMed/NCBI View Article : Google Scholar | |
|
Li Z, Wu X, Li J, Yu S, Ke X, Yan T, Zhu Y, Cheng J and Yang J: HMGA2-Snai2 axis regulates tumorigenicity and stemness of head and neck squamous cell carcinoma. Exp Cell Res. 418(113271)2022.PubMed/NCBI View Article : Google Scholar | |
|
Huang FY, Wong DK, Mak LY, Cheung TT, Seto WK and Yuen MF: Hepatitis B virus X protein promotes hepatocarcinogenesis via the activation of HMGA2/STC2 signaling to counteract oxidative stress-induced cell death. Carcinogenesis. 43:671–681. 2022.PubMed/NCBI View Article : Google Scholar | |
|
Che F, Han Y, Fu J, Wang N, Jia Y, Wang K and Ge J: LncRNA MALAT1 induced by hyperglycemia promotes microvascular endothelial cell apoptosis through activation of the miR-7641/TPR axis to exacerbate neurologic damage caused by cerebral small vessel disease. Ann Transl Med. 9(1762)2021.PubMed/NCBI View Article : Google Scholar | |
|
Yuan S, Norgard RJ and Stanger BZ: Cellular plasticity in cancer. Cancer Discov. 9:837–851. 2019.PubMed/NCBI View Article : Google Scholar | |
|
Yan K, Wang Y, Lu Y and Yan Z: Coexpressed genes that promote the infiltration of M2 macrophages in melanoma can evaluate the prognosis and immunotherapy outcome. J Immunol Res. 2021(6664791)2021.PubMed/NCBI View Article : Google Scholar | |
|
Pratt HG, Steinberger KJ, Mihalik NE, Ott S, Whalley T, Szomolay B, Boone BA and Eubank TD: Macrophage and neutrophil interactions in the pancreatic tumor microenvironment drive the pathogenesis of pancreatic cancer. Cancers (Basel). 14(194)2021.PubMed/NCBI View Article : Google Scholar | |
|
Zhang H, Luo YB, Wu W, Zhang L, Wang Z, Dai Z, Feng S, Cao H, Cheng Q and Liu Z: The molecular feature of macrophages in tumor immune microenvironment of glioma patients. Comput Struct Biotechnol J. 19:4603–4618. 2021.PubMed/NCBI View Article : Google Scholar | |
|
Pardoll DM: The blockade of immune checkpoints in cancer immunotherapy. Nat Rev Cancer. 12:252–264. 2012.PubMed/NCBI View Article : Google Scholar | |
|
Jenkins L, Jungwirth U, Avgustinova A, Iravani M, Mills A, Haider S, Harper J and Isacke CM: Cancer-associated fibroblasts suppress CD8+ T-cell infiltration and confer resistance to immune-checkpoint blockade. Cancer Res. 82:2904–2917. 2022.PubMed/NCBI View Article : Google Scholar | |
|
Asdourian MS, Shah N, Jacoby TV, Semenov YR, Otto T, Thompson LL, Dee EC, Reynolds KL and Chen ST: Development of multiple cutaneous immune-related adverse events among cancer patients after immune checkpoint blockade. J Am Acad Dermatol. 88:485–487. 2023.PubMed/NCBI View Article : Google Scholar | |
|
Hua H, Zhang H, Chen J, Wang J, Liu J and Jiang Y: Targeting Akt in cancer for precision therapy. J Hematol Oncol. 14(128)2021.PubMed/NCBI View Article : Google Scholar | |
|
Paskeh MDA, Ghadyani F, Hashemi M, Abbaspour A, Zabolian A, Javanshir S, Razzazan M, Mirzaei S, Entezari M, Goharrizi MASB, et al: Biological impact and therapeutic perspective of targeting PI3K/Akt signaling in hepatocellular carcinoma: Promises and challenges. Pharmacol Res. 187(106553)2023.PubMed/NCBI View Article : Google Scholar | |
|
Khemlina G, Ikeda S and Kurzrock R: The biology of Hepatocellular carcinoma: Implications for genomic and immune therapies. Mol Cancer. 16(149)2017.PubMed/NCBI View Article : Google Scholar |