


m6A methyltransferase METTL14‑mediated RP1‑228H13.5 promotes the occurrence of liver cancer by targeting hsa‑miR‑205/ZIK1
- Authors:
- Published online on: February 29, 2024 https://doi.org/10.3892/or.2024.8718
- Article Number: 59
-
Copyright: © Xu et al. This is an open access article distributed under the terms of Creative Commons Attribution License.
Abstract
Introduction
Liver cancer is one of the most common malignant tumor types worldwide, with its mortality rate ranking second among malignant tumors, and its incidence rate increasing (1). Every year, liver cancer cases in China account for >50% of worldwide cases (2) and the median survival time of patients with late liver cancer is <5 months (3). Although the pathogenesis of liver cancer has been studied in detail, identifying therapeutic targets for liver cancer remains urgent.
RNA N6-methyladenosine (m6A) methylation modification is a common modification in mRNA and noncoding RNA (ncRNA). It affects RNA cutting, translation, stability and epigenetic effects in certain ncRNAs. Studies have indicated that m6A gene modification can regulate the occurrence and development of liver cancer. For instance, it has been shown that methyltransferase 14, N6-adenosine-methyltransferase subunit (METTL14) upregulates ubiquitin specific peptidase 48 to alleviate liver cancer by regulating Sirtuin 6 stability (4). In addition, it was found that, compared to the normal group, the expression level of vir like m6A methyltransferase associated in the liver cancer group was also higher, and that KIAA1429 was modified by reinforcing ID2 m6A-modified ID2 mRNA expression, promoting the invasion and metastasis of tumor cells (5). It has also been reported that m6A methylation can modify long (l)ncRNA and affect its stability and metabolism (6). To date, only a small number of studies have explored how m6A methylation-modified lncRNA can promote the occurrence and development of liver cancer. Therefore, further study on m6A methylation-modified lncRNA can provide new ideas for the study of lncRNA.
In the present study, based on the The Cancer Genome Atlas (TCGA) dataset, bioinformatics and statistical analyses were conducted on the relevant data of cancer patients to determine the prognostic significance of m6A-related lncRNAs. Using bioinformatics analysis, a risk model consisting of nine genes was established. RP1-228H13.5/hsa microRNA (miR)-205/zinc finger protein interacting with K protein 1 (ZIK1) was selected from the constructed competitive endogenous RNA (ceRNA) network for subsequent research. Finally, the specific effects and molecular mechanisms of RP1-228H13.5 on liver cancer cells were studied using a cell assay.
Materials and methods
Data collection
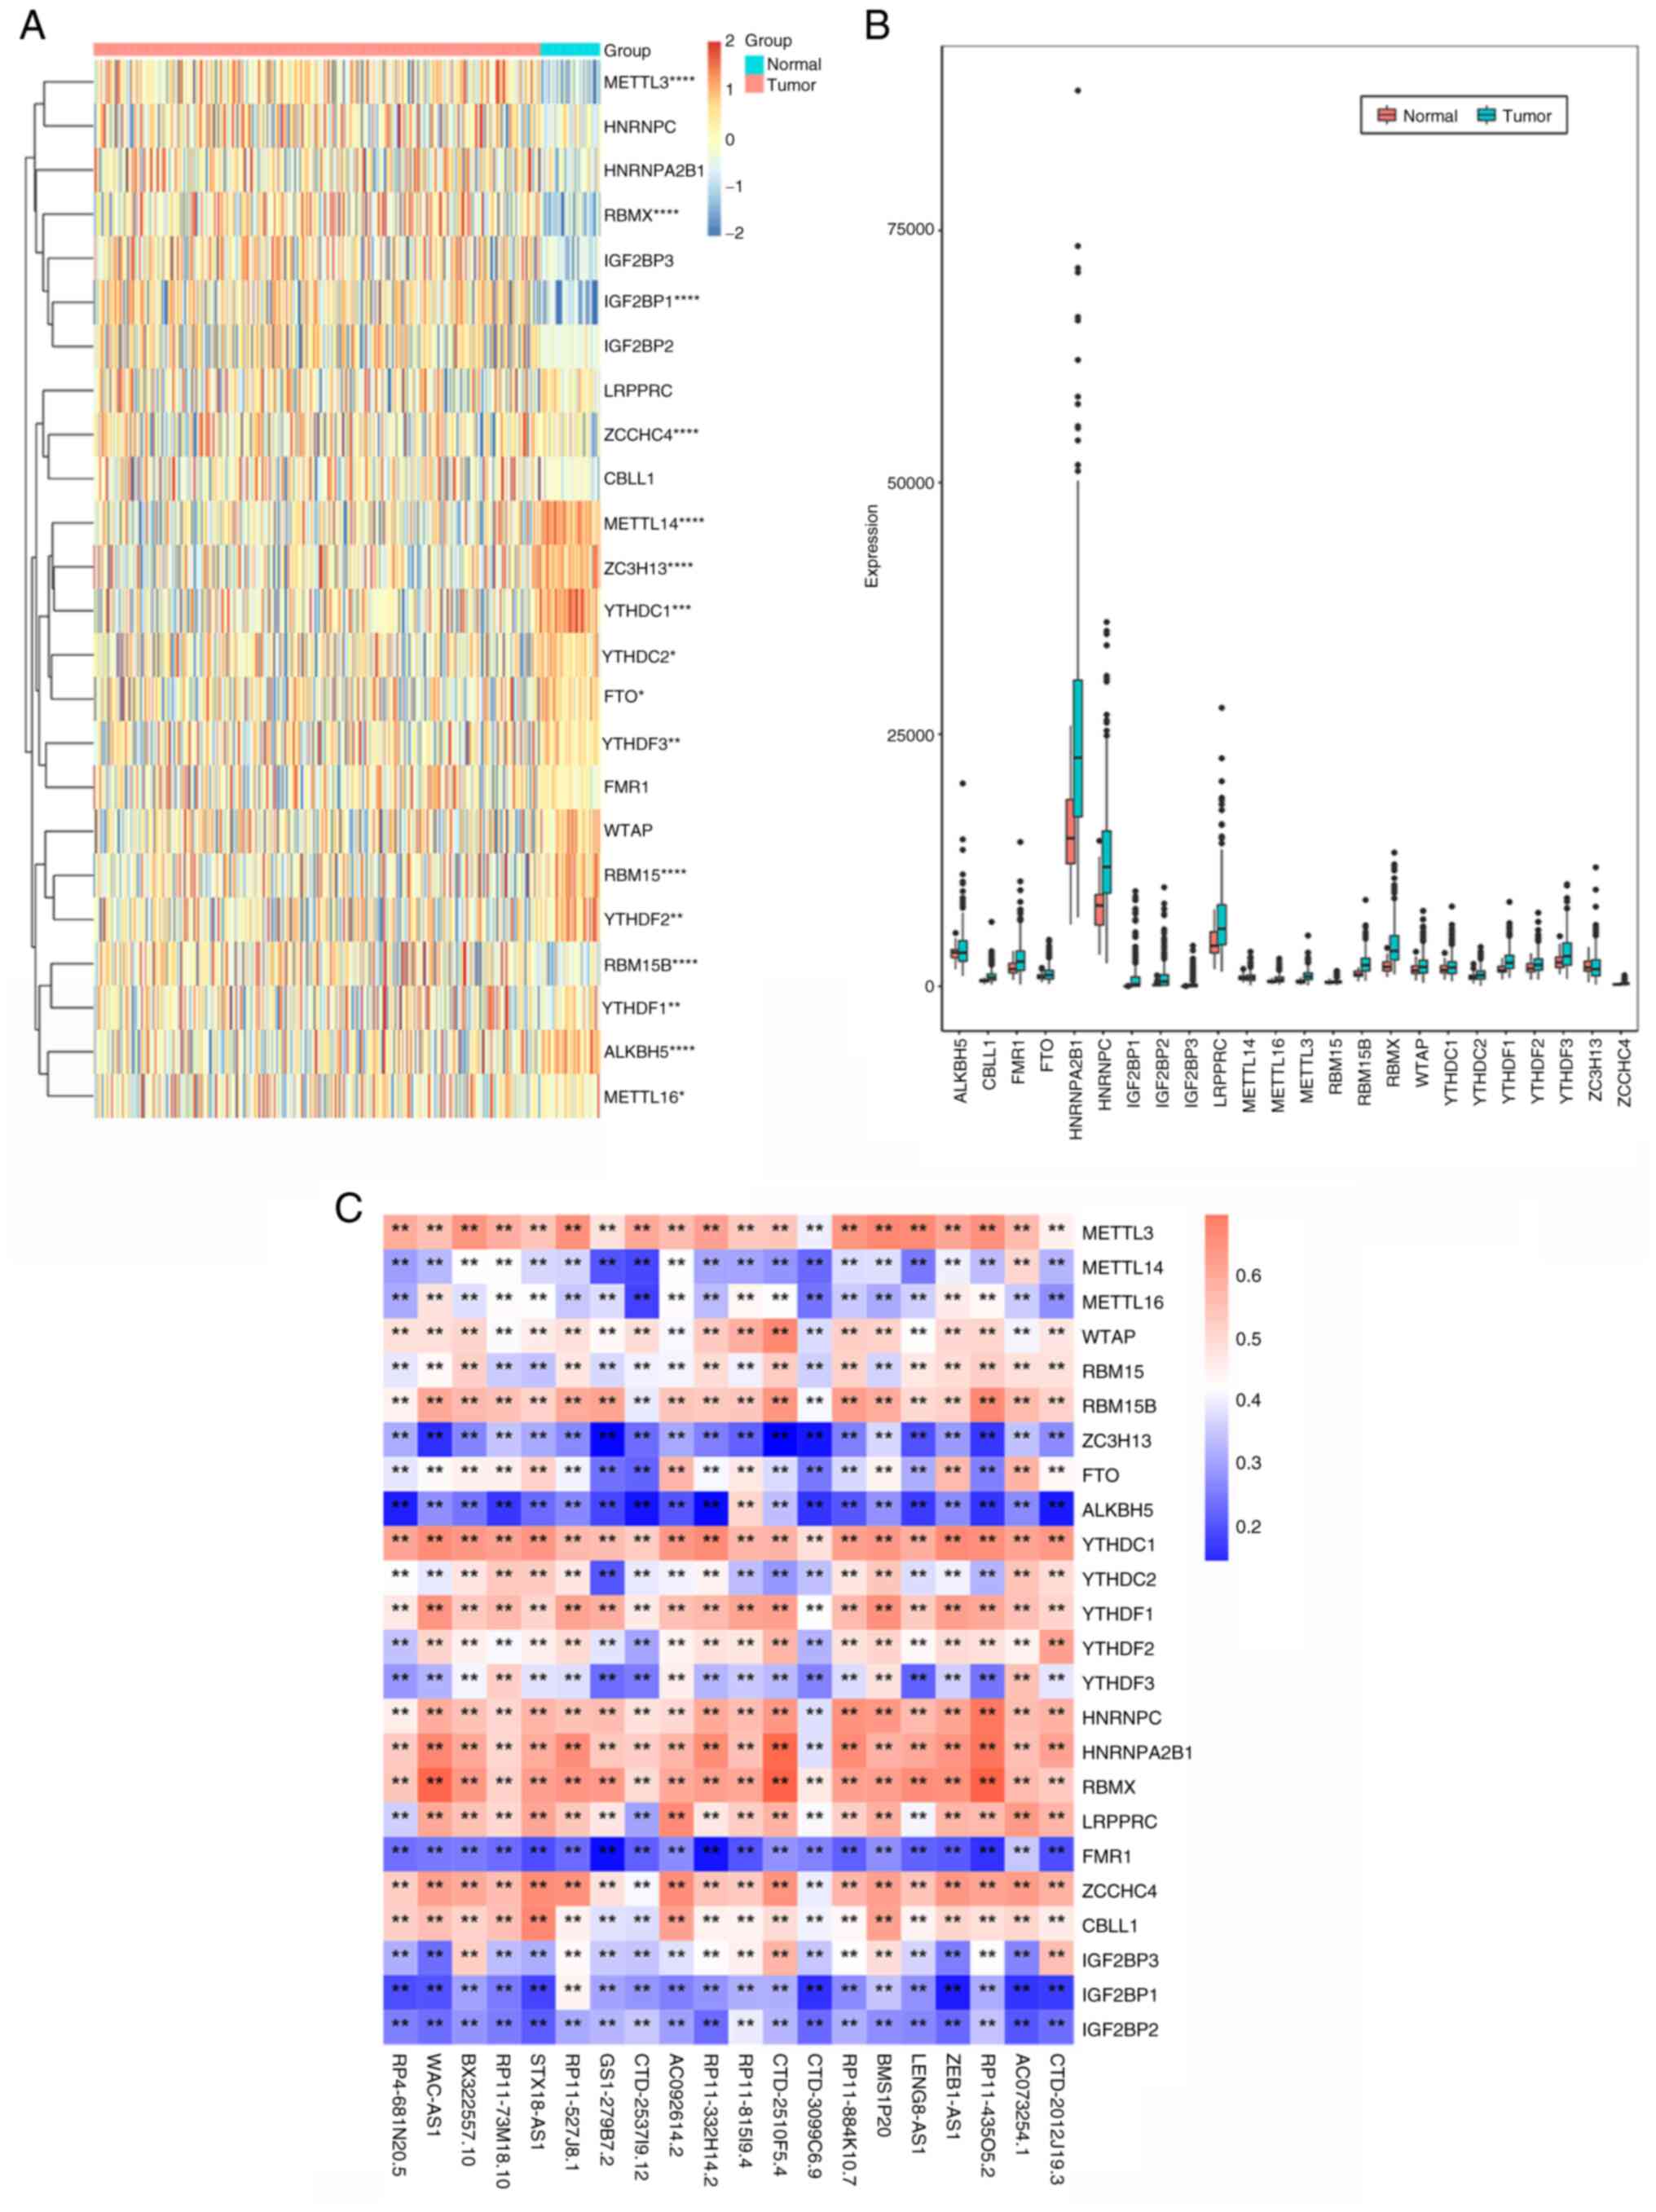
The search term ‘hepatocellular carcinoma’ was used in the TCGA database (https://portal.gdc.cancer.gov) to obtain relevant RNA expression profile data, and the corresponding clinicopathological data were downloaded from the cBioPortal website (https://www.cbioportal.org/), including patient ID, age, survival time, survival status, tumor grade, stage and TNM stage. The deadline for downloading the data was August 9, 2021. In the end, data pertaining to 374 liver cancer samples and 50 control samples were obtained. Samples with incomplete clinical data were excluded from the above samples. Finally, 341 patients with liver cancer samples and 40 normal controls were included in the present study. By reviewing m6A-related literature (7–9), a total of 24 m6A-related genes were extracted from RNA expression profiles, including writers (METTL3, METTL14, METTL16, WTAP, RBM15, RBM15B, ZCCHC4, CBLL1 and ZC3H13), erasers (FTO and ALKBH5) and readers (YTHDC1, YTHDC2, YTHDF1, YTHDF2, YTHDF3, HNRNPC, HNRNPA2B1, RBMX, LRPPRC, FMR1, IGF2BP3, IGF2BP1 and IGF2BP2). Differentially expressed genes (DEGs) between the normal and cancer groups were identified using the DESeq2 package (DOI: 10.18129/B9.bioc.DESeq2), in which P<0.001 indicated extremely significant, P<0.01 very significant and P<0.05 significant. The ‘Pheatmap’ and ‘ggplot 2’ software packages in R language (version 4.3.0; https://r-charts.com/correlation/pheatmap/; R Foundation for Statistical Computing) were used to draw the expression heat and violin maps of DEGs. The lncRNA annotation file was downloaded from the GENCODE website (https://www.gencodegenes.org/) to identify and annotate the lncRNAs in the TCGA dataset.
Correlation analysis between m6A genes and m6A gene-related lncRNA
Pearson's correlation coefficient was used to analyze the correlation between m6A genes and lncRNAs. LncRNAs with an absolute correlation coefficient R>0.5 and P<0.001 were considered to be m6A-related lncRNAs.
Bioinformatics analysis
In order to determine the prognostic value of m6A-related lncRNAs, univariate Cox regression analysis was performed on m6A-related lncRNAs. First, the original data of m6A-related lncRNAs were standardized in the form of log2(x+1). Univariate Cox analysis was performed on m6A-related lncRNAs using the ‘survival’ package in R language to screen prognosis-related lncRNAs. Next, the R software package ‘glment’ was used for Cox regression analysis of Least Absolute Shrinkage and Selection Operator (LASSO), a Cox proportional risk model was built and the risk score was calculated. The calculation formula of the risk score was as follows:
 |
where Coefi refers to the coefficients and Xi is the FPKM value of each m6A-related lncRNA. The risk score of all patients was calculated, the median value of the risk score was selected as the critical value and patients were divided into high- and low-risk groups. The ‘survival’ package was further used to compare the overall survival (OS) rate between high- and low-risk groups through Kaplan-Meier analysis, and the survival curves were drawn. The ‘Survival Receiver Operating Characteristic (ROC)’ package was used to evaluate the predictive value of the LASSO regression Cox proportional hazards construction model through the area under the ROC curve (AUC). In order to study the difference between risk grouping and clinical characteristics, a χ2 test was performed, the difference in clinical characteristics between the high- and low-risk groups was evaluated and a heat map was drawn using the ‘pheatmap’ software package. Univariate and multivariate Cox analysis were performed using the ‘survival’ package to select independent predictors of OS, and visualized through the ‘forest’ software package.
ceRNA network and functional enrichment analysis of genes
The targeted miRNAs of m6A-related lncRNAs were predicted using the Perl programming language through the miRcode database (http://www.mircode.org/index.php miRcode) and the targeted mRNAs of these miRNAs were predicted using the miRTarBase (http://mirtarbase.mbc.nctu.edu.tw/php/index.php), miRDB (http://www.mirdb.org/) and TargetScan (http://www.targetscan) databases. The ceRNA network was constructed using ‘Cytoscape’ software (http://www.cytoscape.org/) and the results were visualized. The patients were divided into high- and low-risk groups using the median risk score. The differential gene expression of the high-risk and low-risk groups was analyzed. DEGs were screened using P<0.05, and |log2 fold change (FC)|>2 was used to perform the functional and pathway enrichment analysis of DEGs in the high- and low-risk groups, and 201 target mRNAs in the ceRNA network. Log2FC refers to the difference in gene expression between two samples. This is a commonly used concept in bioinformatics analysis. Specifically, log2FC is an indicator that measures the magnitude of changes in gene expression levels. By calculating the expression ratio between two samples (such as the expression level of sample 1/sample 2) and then taking logarithms (based on 2), the value of log2FC can be obtained. Compared to directly calculating the difference in gene expression levels, using log2FC can more accurately reflect the degree of difference between gene expression levels. Kyoto Encyclopedia of Genes and Genomes (KEGG) enrichment analysis is a bioinformatics method used to explain and understand the function of genes or proteins and the metabolic pathways involved. Gene ontology (GO) enrichment analysis is a statistical method widely used in bioinformatics research, mainly used to test the degree of enrichment of certain functions or features in a gene set. Using KEGG and GO enrichment analysis to analyze differentially expressed genes.
Cell culture and cell transfection
The THLE-2 human normal liver cell line and the SNU-398, Huh-7 and Hep3B2.1–7 human liver cancer cell lines were purchased from the American Type Culture Collection and cultured in DMEM (Gibco; Thermo Fisher Scientific, Inc.) containing 10% FBS (Gibco; Thermo Fisher Scientific, Inc.). The cells were cultured at 37°C in a saturated humidified atmosphere with 5% CO2. The day before transfection, the cells were seeded into 96-well plates with an inoculation density of 1×10⁶ cells/well. When the cell density reached 50–80%, short hairpin RNA (sh)-RP1-228H13.5 (sequence, 5′-CAGAGAAAGGTGACTGAAGGA-3′), overexpression vector (OV)-RP1-228H13.5, mimics-negative control (NC) (sequence, sense: 5′-UUGUACUACACAAAAGUACUG-3′; antisense: 5′-GUACUUUUGUGUAGUACAAUU-3′) [corresponding sh-NC (5′-CAGUACUUUUGUGUAGUACAA-3′) and OV-NC], miR-205-5p mimics (sequence, sense: 5′-UCCUUCAUUCCACCGGAGUCUG-3′; antisense: 5′-GACUCCGGUGGAAUGAAGGAUU-3′), inhibitor-NC (sequence, 5′-CAGUACUUUUGUGUAGUACAA-3′), miR-205-5p inhibitor (sequence, 5′-CAGACUCCGGUGGAAUGAAGGA-3′), Sh-METTL14 (sequence, 5′-ATGGATAGCCGCTTGCAGGAG-3′) and OV-METTL14 [corresponding Sh-NC (5′-CAGUACUUUUGUGUAGUACAA-3′) and OV-NC] were transfected into the cells using Lipofectamine™ 2000 (Invitrogen; Thermo Fisher Scientific, Inc.), according to the manufacturer's instructions. To achieve overexpression of RP1-228H13.5 and METTL14, pcDNA3.1-RP1-228H13.5 and pcDNA3.1-METTL14 vectors were designed and constructed. The final transfection concentration of the vector in a 6-well plate was 2 µg/ml. The above-mentioned oligonucleotide primers were synthesized by Shenggong Corporation. pcDNA3.1™ plasmid was purchased from Invitrogen (Thermo Fisher Scientific, Inc.).
Reverse transcription-quantitative PCR (RT-qPCR)
The experiment was performed according to the manufacturer's instructions. Total RNA was extracted by the TRIzol® one-step method and 2 µg of total RNA was reverse-transcribed into cDNA using the PrimeScript RT Master Mix RT Kit (Takara Biotechnology Co., Ltd.). A final reaction volume of 20 µl was established in accordance with the SYBR Green PCR Master Mix (Thermo Fisher Scientific, Inc.). The PCR thermocycling parameters were set to 95°C for 5 min for initial denaturation, followed by 35 cycles of denaturation at 94°C for 30 sec, annealing at 60°C for 30 sec and extension at 72°C for 30 sec. Primers were designed by Primer Premier Software 5.0 (Premier Biosoft International) and synthesized by Invitrogen (Thermo Fisher Scientific, Inc.). Real-time qPCR was performed on an ABI 7500 system (Thermo Fisher Scientific, Inc.). GAPDH was used as the internal reference in the experiment. The 2−ΔΔCq method (10) was employed to assess relative expression levels. The primer sequences used are listed in Table I.
Cell Counting Kit-8 (CCK-8) assay
Cell proliferative activity was examined using a CCK-8 kit (Dojindo Molecular Technologies, Inc.). One day before the experiment, the cells in the logarithmic growth phase were inoculated into a 96-well plate at a density of 1,000 cells/well and then cultured in an incubator at 37°C. The next day, the cells were transfected with Sh-RP1-228H13.5 and OV-RP1-228H13.5 (NC). Following transfection, the cells were cultured for 24, 48 or 72 h, CCK-8 reagent (10 µl/well; Thermo Fisher Scientific, Inc.) was added to the culture wells, followed by incubation for 2 h at 37°C. The absorbance at 450 nm was read by a microplate reader (Bio-Rad Laboratories, Inc.). A cell proliferation curve was then drawn.
Wound-healing assay
The transfected cells were inoculated in 6-well plates at a density of 1×10⁶/well. Serum-free culture medium was used for the wound-healing assay. Using a 200-µl pipette tip, three scratches perpendicular to the marking line were drawn in the cell culture plate. The floating cells were then washed away with PBS. Three scratch locations were selected and photographed at 0 and 24 h to record cell migration, which was quantified as follows: Migration rate=(0 h wound distance-24 h wound distance)/0 h wound distance ×100%.
Transwell assay
Matrigel® (BD Biosciences) was added into the upper chambers (8 µm pore size) of Transwell inserts (Thermo Fisher Scientific, Inc.) and incubated in a cell incubator for ~2 h for the cell invasion assay. The cells were transfected for 24 h, digested with trypsin (Thermo Fisher Scientific, Inc.) and resuspended with 400 µl serum-free cell culture medium. Cell suspension (5×10³ cells in 100 µl) was inoculated into the upper Transwell chambers and 600 µl DMEM with 10% serum was added to the lower chambers. After 24 h of culture, the medium in the upper chamber was removed and the cells in the upper chamber that had not transgressed to the lower side of the membrane were gently wiped off using defatted cotton. Next, the chamber was placed in 4% paraformaldehyde solution, fixed at room temperature for 20 min and then stained with 0.1% crystal violet solution at room temperature for 15 min. A total of five visual fields were randomly observed and photographed by Olympus CX43 Fluorescence Microscope and the number of invaded cells was calculated. In the cell migration assay, no Matrigel® was added to the upper chamber of the Transwell, while the other steps were the same as those in the cell invasion assay.
Flow cytometry
After 48 h of cell transfection, the cells were collected and rinsed with PBS twice. They were then mixed with 500 µl of pre-cooled 1X binding buffer and 5 µl Annexin-V-FITC (cat. no. 88-8102-72; Invitrogen; Thermo Fisher Scientific, Inc.), incubated at room temperature for 15 min, and 2.5 µl propidium iodide was added for 5 min at room temperature. The apoptotic rate was detected using flow cytometry (FACSCalibur; BD Biosciences) and anlysed by BD CellQuest Pro software (version 5.1). The experiment was repeated three times.
Fluorescence in situ hybridization (FISH)
The coverslips which coated with poly-L-lysin were placed on a 24-well plate and an appropriate number of cells were cultured (~6×10⁻⁴/well). Next, 4% paraformaldehyde was used to incubated cells for 10 min at 4°C. Pre-cooled (4°C) permeabilization solution (PBS containing 0.5% Triton-X100) was added to each well, incubated at 4°C for 5 min and then discarded. Pre-hybridization solution (200 µl) was added to each well and sealed at 37°C for 30 min. Under dark conditions, 2.5 µl 20 µM RP1-228H13.5 probe mix storage solution (probe sequence: 5′-TGAATTATCTAAAGTAAAGCTATAAATCCAGAATATATACCAGTATCTCTAGAATTTTTCATATTACTACATTTACTTAA-3′) or internal reference FISH Probe Mix storage solution was added to 100 µl of hybridization solution. Probes were synthesized by Shenggong Corporation and the in situ hybridization kit was purchased from Beyotime Institute of Biotechnology. The pre-hybridization solution was discarded from each well, 100 µl probe hybridization solution containing probes was added and hybridization was performed overnight at 37°C while avoiding light. Subsequently, while avoiding light, each well was washed three times at 42°C with hybrid washing solution I for 5 min each time to reduce the background signal. Subsequently, avoiding light, cells were washed once with hybrid detergent II and once with hybrid washing solution III, both at 42°C. Next, avoiding light, cells were washed with 1X PBS at room temperature for 5 min. Staining with DAPI solution was then performed for 10 min at room temperature. Under dark conditions, the coverslips were carefully removed from the well and fixed on a slide with a sealing agent (Beyotime Institute of Biotechnology) for fluorescence detection at room temperature.
Dual-luciferase assay
Starbase 2.0 (http://starbase.sysu.edu.cn/) was used to predict the binding sites of RP1-228H13.5 and miR-205-5p, as well as those of miR-205-5p and ZIK1. The construction of reporter vector pmirGLO-negative control (NC), pmirGLO-RP1-228H13.5-wild-type (wt), pmirGLO-RP1-228H13.5-mutant (mut), pmirGLO-ZIK1-wt and pmirGLO-ZIK1-3′-untranslated region mut (complementary mutations were performed on the sequence combining ZIK1 with miR-205-5p; ATGAAGGA mutates to UACUUCCU), or synthesis of miR-NC mimics or miR-205-5p mimics were performed by Sangon Biotech Co., Ltd. The pmirGLO vector was from Promega Corp. Upon cell confluence reaching 70–80%, each reporter plasmid with miR-NC mimics or miR-205-5p mimics were co-transfected into 293T cells (cat. no. ACS-4500; American Type Culture Collection) using Lipofectamine® 2000 (Invitrogen; Thermo Fisher Scientific, Inc.). At 24 h after transfection, the relative firefly luciferase activity was detected using a Dual-Glo Luciferase Reporter assay system (Promega Corp.).
RNA pull-down assay
RNA pull-down assays were performed using a Pierce Magnetic RNA-Protein Pull-Down kit (cat. no. 20164; Thermo Fisher Scientific, Inc.), according to the manufacturer's instructions. In brief, 1×10⁷ cells were treated with 500 µl RIPA buffer (Thermo Fisher Scientific, Inc.), centrifuged at 4°C for 15 min at 10,000 × g, and the lysates in the supernatant were collected. Subsequently, biotinylated miR-205-5p probe (5′-UCCUUCAUUCCACCGGAGUCUG-biotin-3′) and the control probe (5′-CUCUGAGGCCACCUUACUUCCU-biotin-3′), synthesized by Sangon Biotech Co., Ltd., along with streptavidin magnetic beads, were incubated at 4°C for 2 h with 500 µl cell lysate. Subsequently, the mixture was washed with wash buffer twice and the eluate was then analyzed using RT-qPCR as indicated above.
For RNA chromatin immunoprecipitation, the supernatant of the lysates was collected and IgG or METTL14 antibody was added from the Magna RIP Kit (cat. no. 17-700; Sigma-Aldrich; Merck KGaA). The immunoprecipitation of METTL14-associated long intergenic RNA was verified by RT-qPCR.
Western blot analysis
Cells were inoculated in a 6-well plate, transfected with plasmid and placed in a cell culture incubator with a constant temperature and humidity for 48 h, and cells were then collected. Cells were lysed with radioimunoprecipitation assay buffer (Beyotime Institute of Biotechnology) and a BCA kit (Beyotime Institute of Biotechnology) was used to determine the protein concentration, followed by denaturation, electrophoresis separation, membrane transfer, washing and sealing (11). Next, a ZIK1 primary antibody (dilution, 1:1,000; cat. no. bs-19266R; Shanghai Bioplus Biotech Co., Ltd.) was added for overnight incubation at 4°C, followed by the addition of a secondary antibody (dilution, 1:1,000; cat. no. bs-0295G-HRP; BIOSS Antibodies Co., Ltd.). The blot was finally developed using enhanced chemiluminescence reagents (Amersham; Cytiva) and GAPDH (dilution, 1:10,000; cat. no. ab181602; Abcam) was used as the internal reference.
Statistical analysis
R software (version 4.3.0) was used for statistical analysis and continuous variables were expressed as the mean ± standard deviation or median ± interquartile range. Fisher's exact test or the χ2 test were used to test differences between groups. Pearson's correlation coefficient was calculated to determine the correlation between parameters. Kaplan-Meier curves were drawn and the log-rank test was used to analyze the survival rate. Multivariate Cox regression analysis was used to determine the independent prognostic factors of OS. GraphPad Prism 5.0 software (GraphPad Software; Dotmatics) and SPSS 18.0 statistical software (SPSS, Inc.) were used for statistical data analysis. One-way ANOVA was used to compare the mean differences among three or more groups and the Student-Newman-Keul's test was used as a post-hoc test, while unpaired t-tests were used to calculate the mean differences between two groups. P<0.05 was considered to indicate a statistically significant difference.
Results
The 24 m6A regulatory genes and related lncRNAs identified in patients with liver cancer
The expression profile data of 24 m6A-related genes were extracted from the TCGA dataset, of which 5 (RBMX, RBM15B, IGF2BP1, METTL3 and YTHDF1) were significantly upregulated in tumor tissues and 11 (ZCCHC4, METTL14, ZC3H13, ALKBH5, RBM15, YTHDC1, YTHDF2, YTHDC2, YTHDF3, METTL16 and FTO) were significantly downregulated in tumor tissues (Fig. 1A and B). The lncRNA annotation file was downloaded from the GENCODE website and 14,816 lncRNAs were identified from the TCGA dataset. Through Pearson's correlation analysis, using |Pearson R|>0.5 and P<0.001 as the threshold, the co-expressed lncRNA and mRNA pairs were screened and the co-expression relationship pairs containing 22 m6A genes and 287 lncRNAs were finally obtained.
Univariate Cox regression analysis of m6A gene-related lncRNA expression and prognosis
Univariate Cox regression was used to screen out prognosis-related lncRNAs from 287 m6A-related lncRNAs (P<0.05). It was found that 89 m6A-related lncRNAs were significantly associated with the prognosis of patients with liver cancer. The association between 24 m6A-related genes and prognosis-related lncRNAs in the TCGA dataset is presented in Fig. 1C (the figure only shows 20 lncRNAs). The results of the univariate Cox analysis of m6A-related lncRNAs are provided in Table II.
LASSO regression analysis of m6A regulatory gene-related lncRNA expression and prognosis in patients with liver cancer
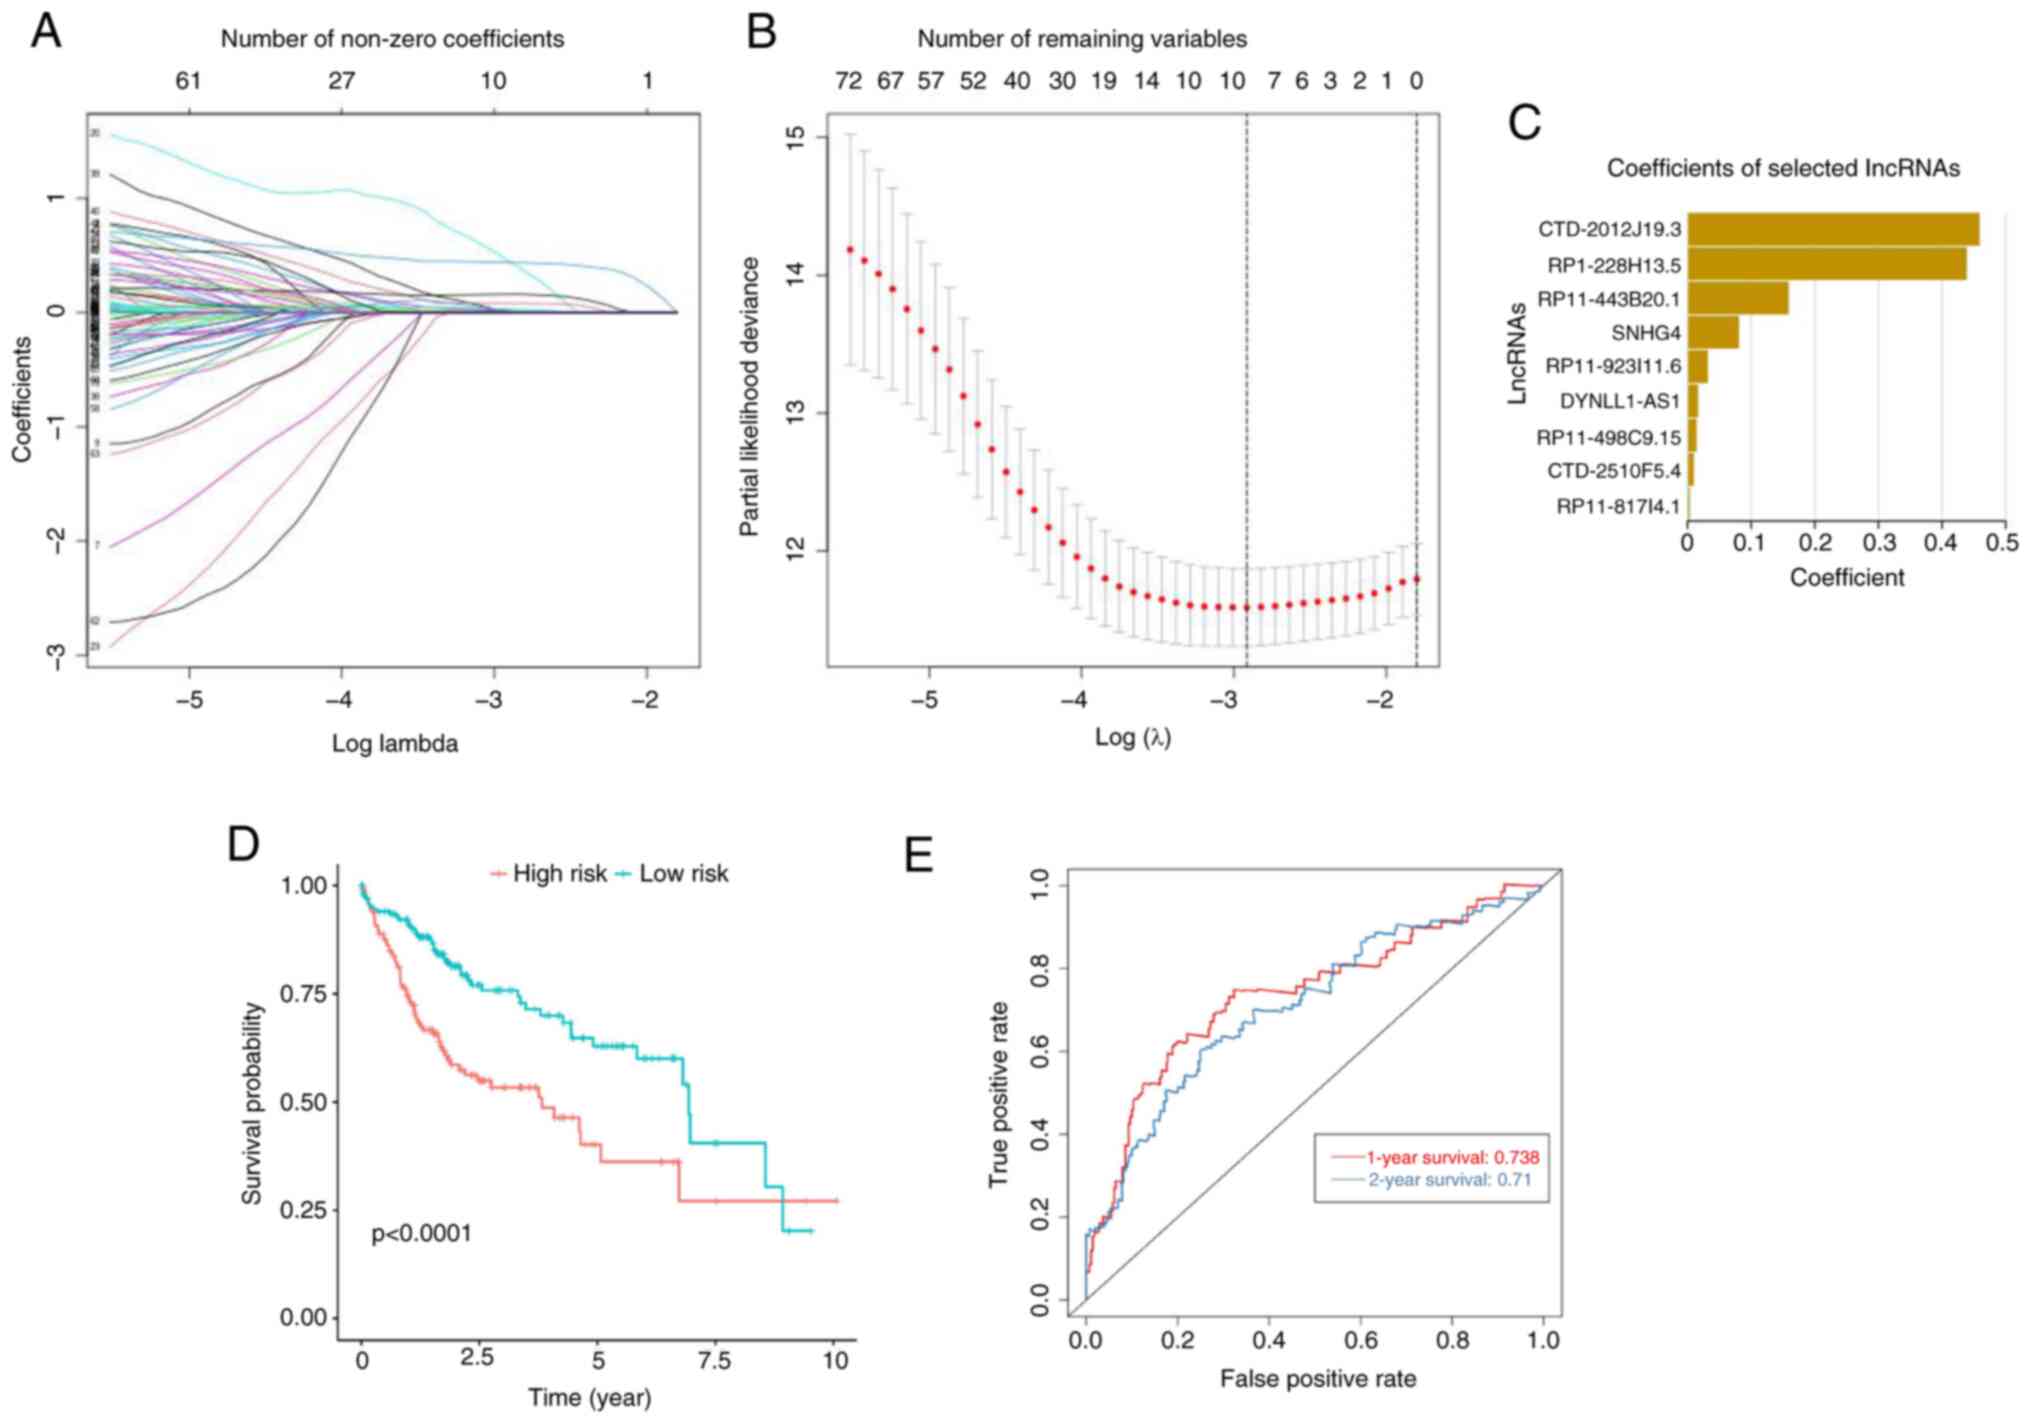
LASSO regression analysis was performed on 89 genes screened by single-factor Cox regression analysis; a risk prediction model was established and the risk value was calculated. The risk model includes nine lncRNAs (CTD-2510F5.4, CTD-2012J19.3, SNHG4, RP1-228H13.5, RP11-443B20.1, DYNLL1-AS1 RP11-498C9.15, RP11-923I11.6 and RP11-817I4.1), which are nine m6A-related lncRNAs, and the coefficient for each lncRNA is shown in Fig. 2A and B. For each patient in the TCGA dataset, the risk score was calculated according to the coefficient of each lncRNA and the risk score is shown in Fig. 2C. According to the median risk score, patients with liver cancer were divided into low- and high-risk subgroups and the R language was used for survival analysis. The patient prognosis was made according to their risk scores. The results of the Kaplan-Meier survival curve analysis show risk scores related to patient prognosis. The clinical prognosis of patients with liver cancer with high risk scores was poor (the OS rate was low and the OS was short), while the clinical prognosis of patients with liver cancer with a low risk score was better (higher OS rate, longer OS time), and differences were significant (Fig. 2D). The ROC curve showed that the risk model had a good predictive value for prognosis (1-year OS AUC=0.738; 2-year OS AUC=0.71; Fig. 2E).
Prognostic analysis of nine m6A-related lncRNAs
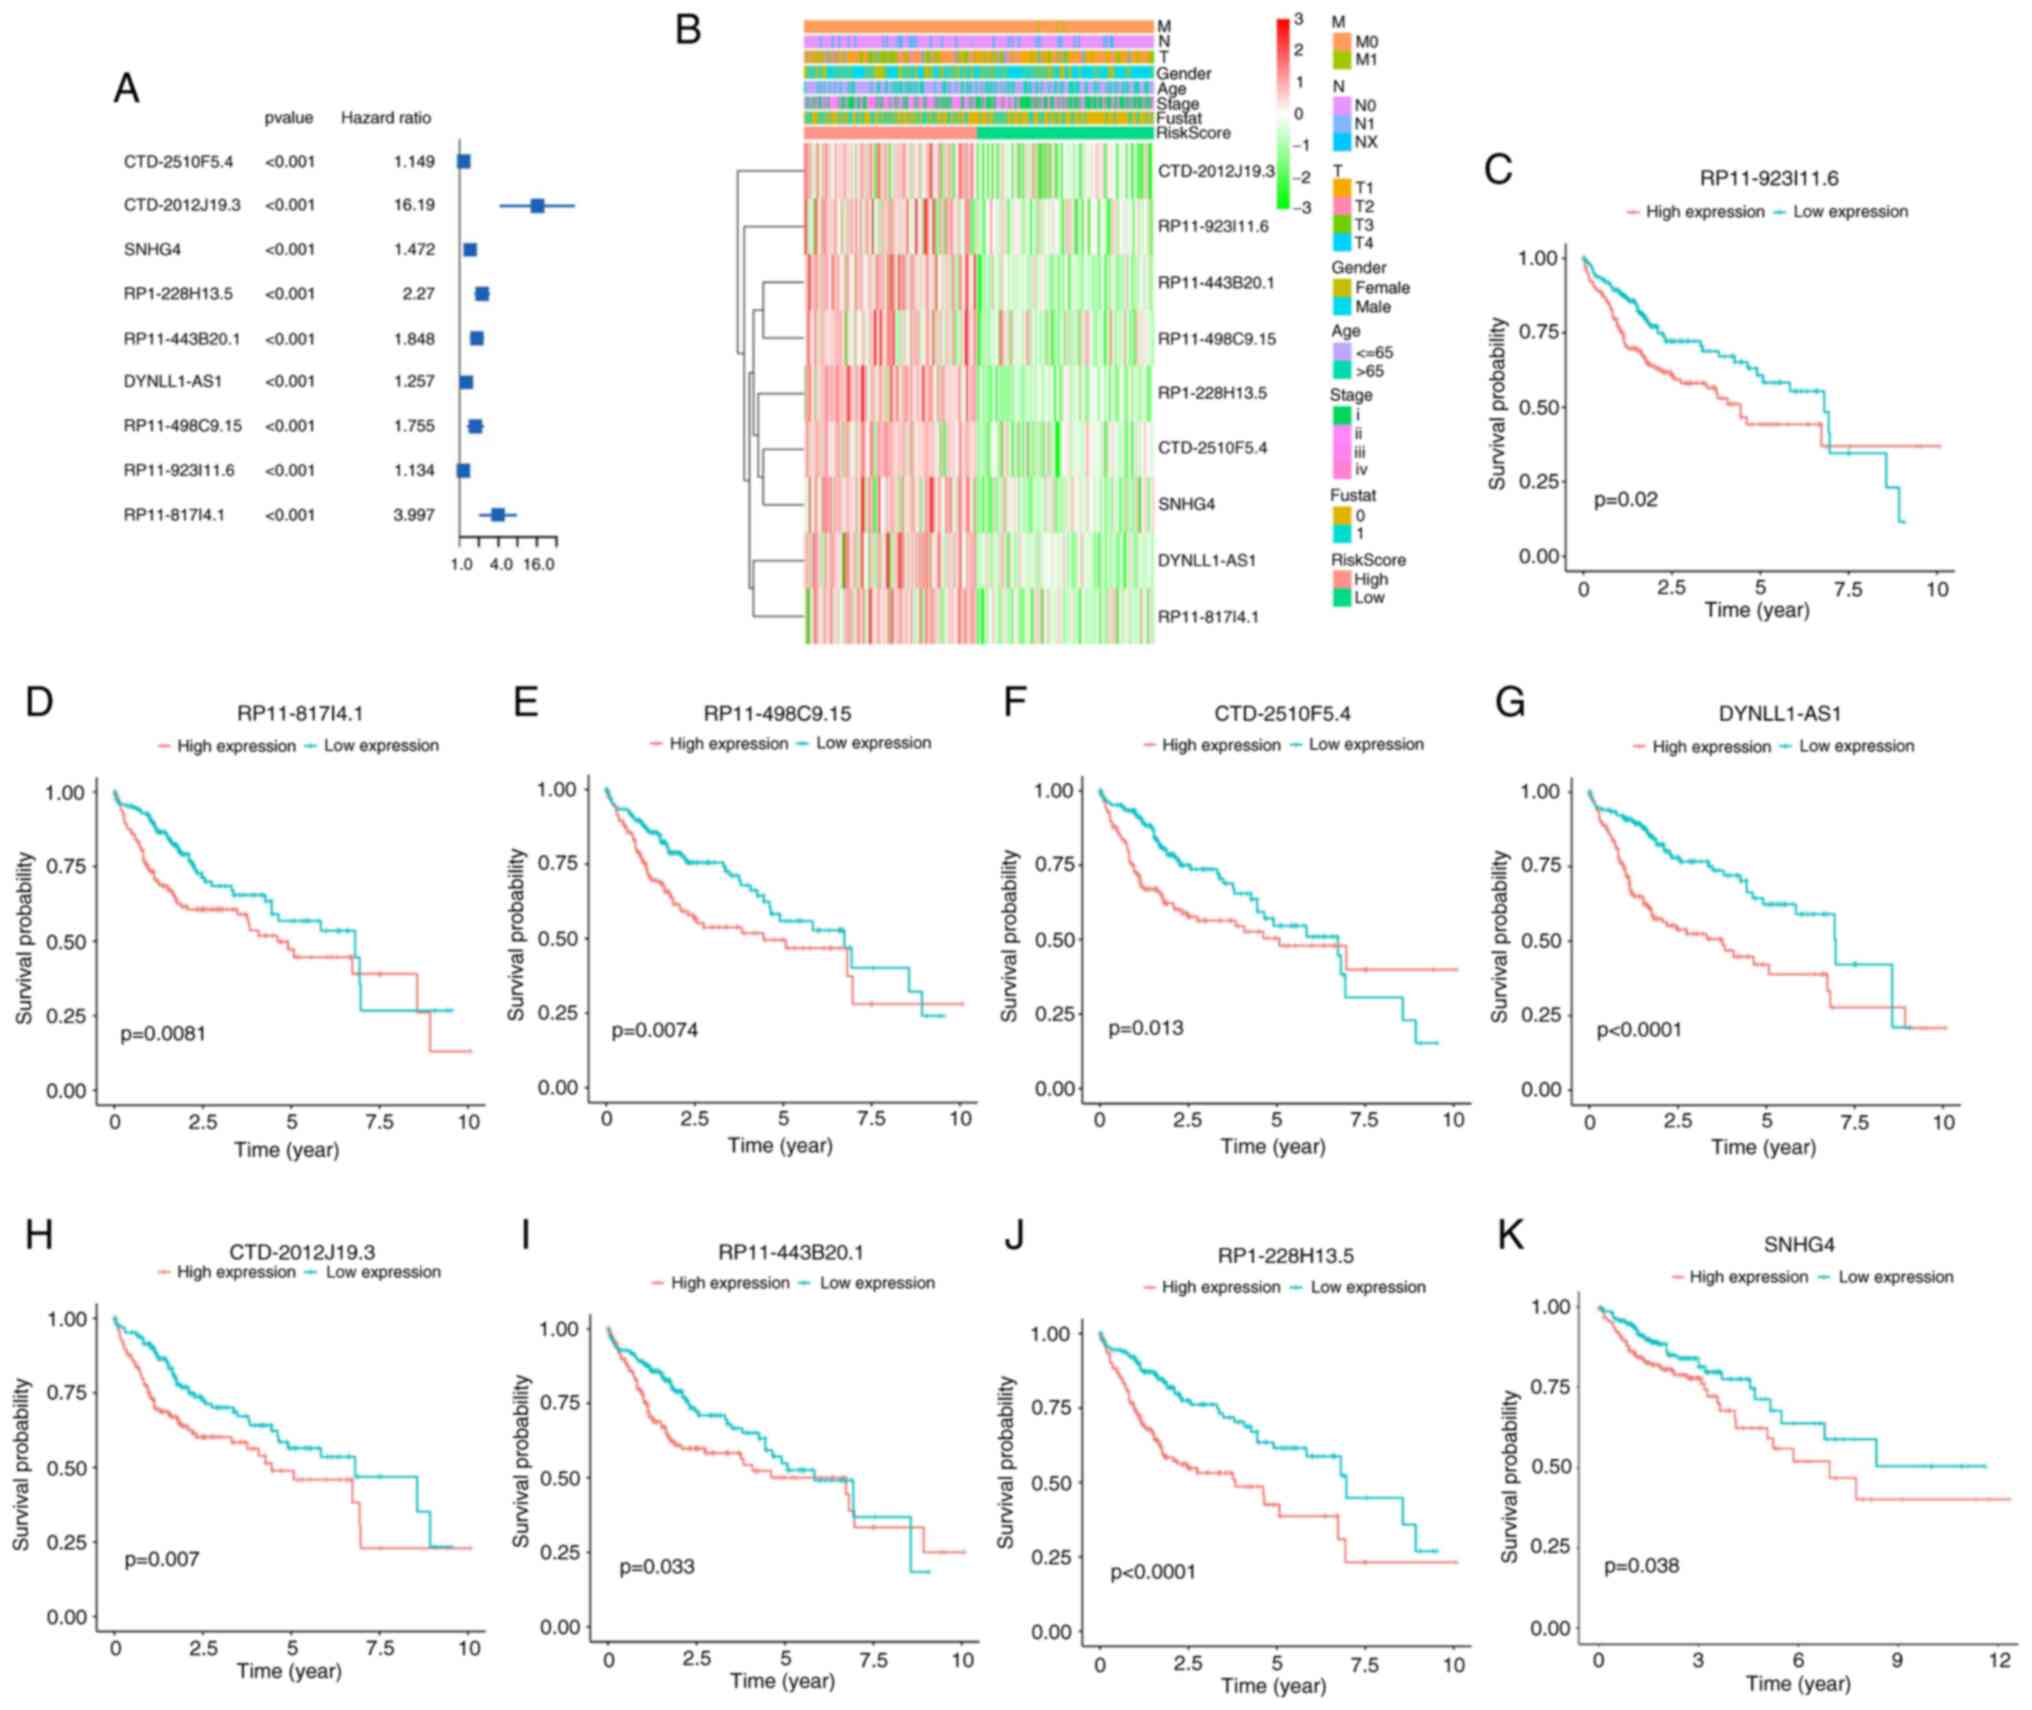
A total of nine lncRNAs were included in the risk assessment model and single-variable COX regression analysis was used to assess the prognosis of the nine lncRNAs. The forest plot indicated that the nine lncRNAs (CTD-2510F5.4, CTD-2012J19.3, SNHG4, RP1-228H13.5, RP11-443B20.1, DYNLL1-AS1, RP11-498C9.15, RP11-923I11.6 and RP11-817I4.1) are risk factors for patients with liver cancer [hazard ratio (HR)>1; P<0.001; Fig. 3A]. The heat map showed that the expression of CTD-2510F5.4, CTD-2012J19.3, SNHG4, RP1-228H13.5, RP11-443B20.1, DYNLL1-AS1, RP11-498C9.15, RP11-923I11.6 and RP11-817I4.1 increased as the risk score increased. The expression of the nine lncRNAs was also associated with clinicopathological features of liver cancer, such as stage, gender, age and fustat (Fig. 3B). The Kaplan-Meier survival curves showed that in the TCGA dataset, low expression of CTD-2510F5.4, CTD-2012J19.3, SNHG4, RP1-228H13.5, RP11-443B20.1, DYNLL1-AS1, RP11-498C9.15, RP11-923I11.6 and RP11-817I4.1 was associated with favorable prognosis (Fig. 3C-K).
Association between clinicopathological features and risk score
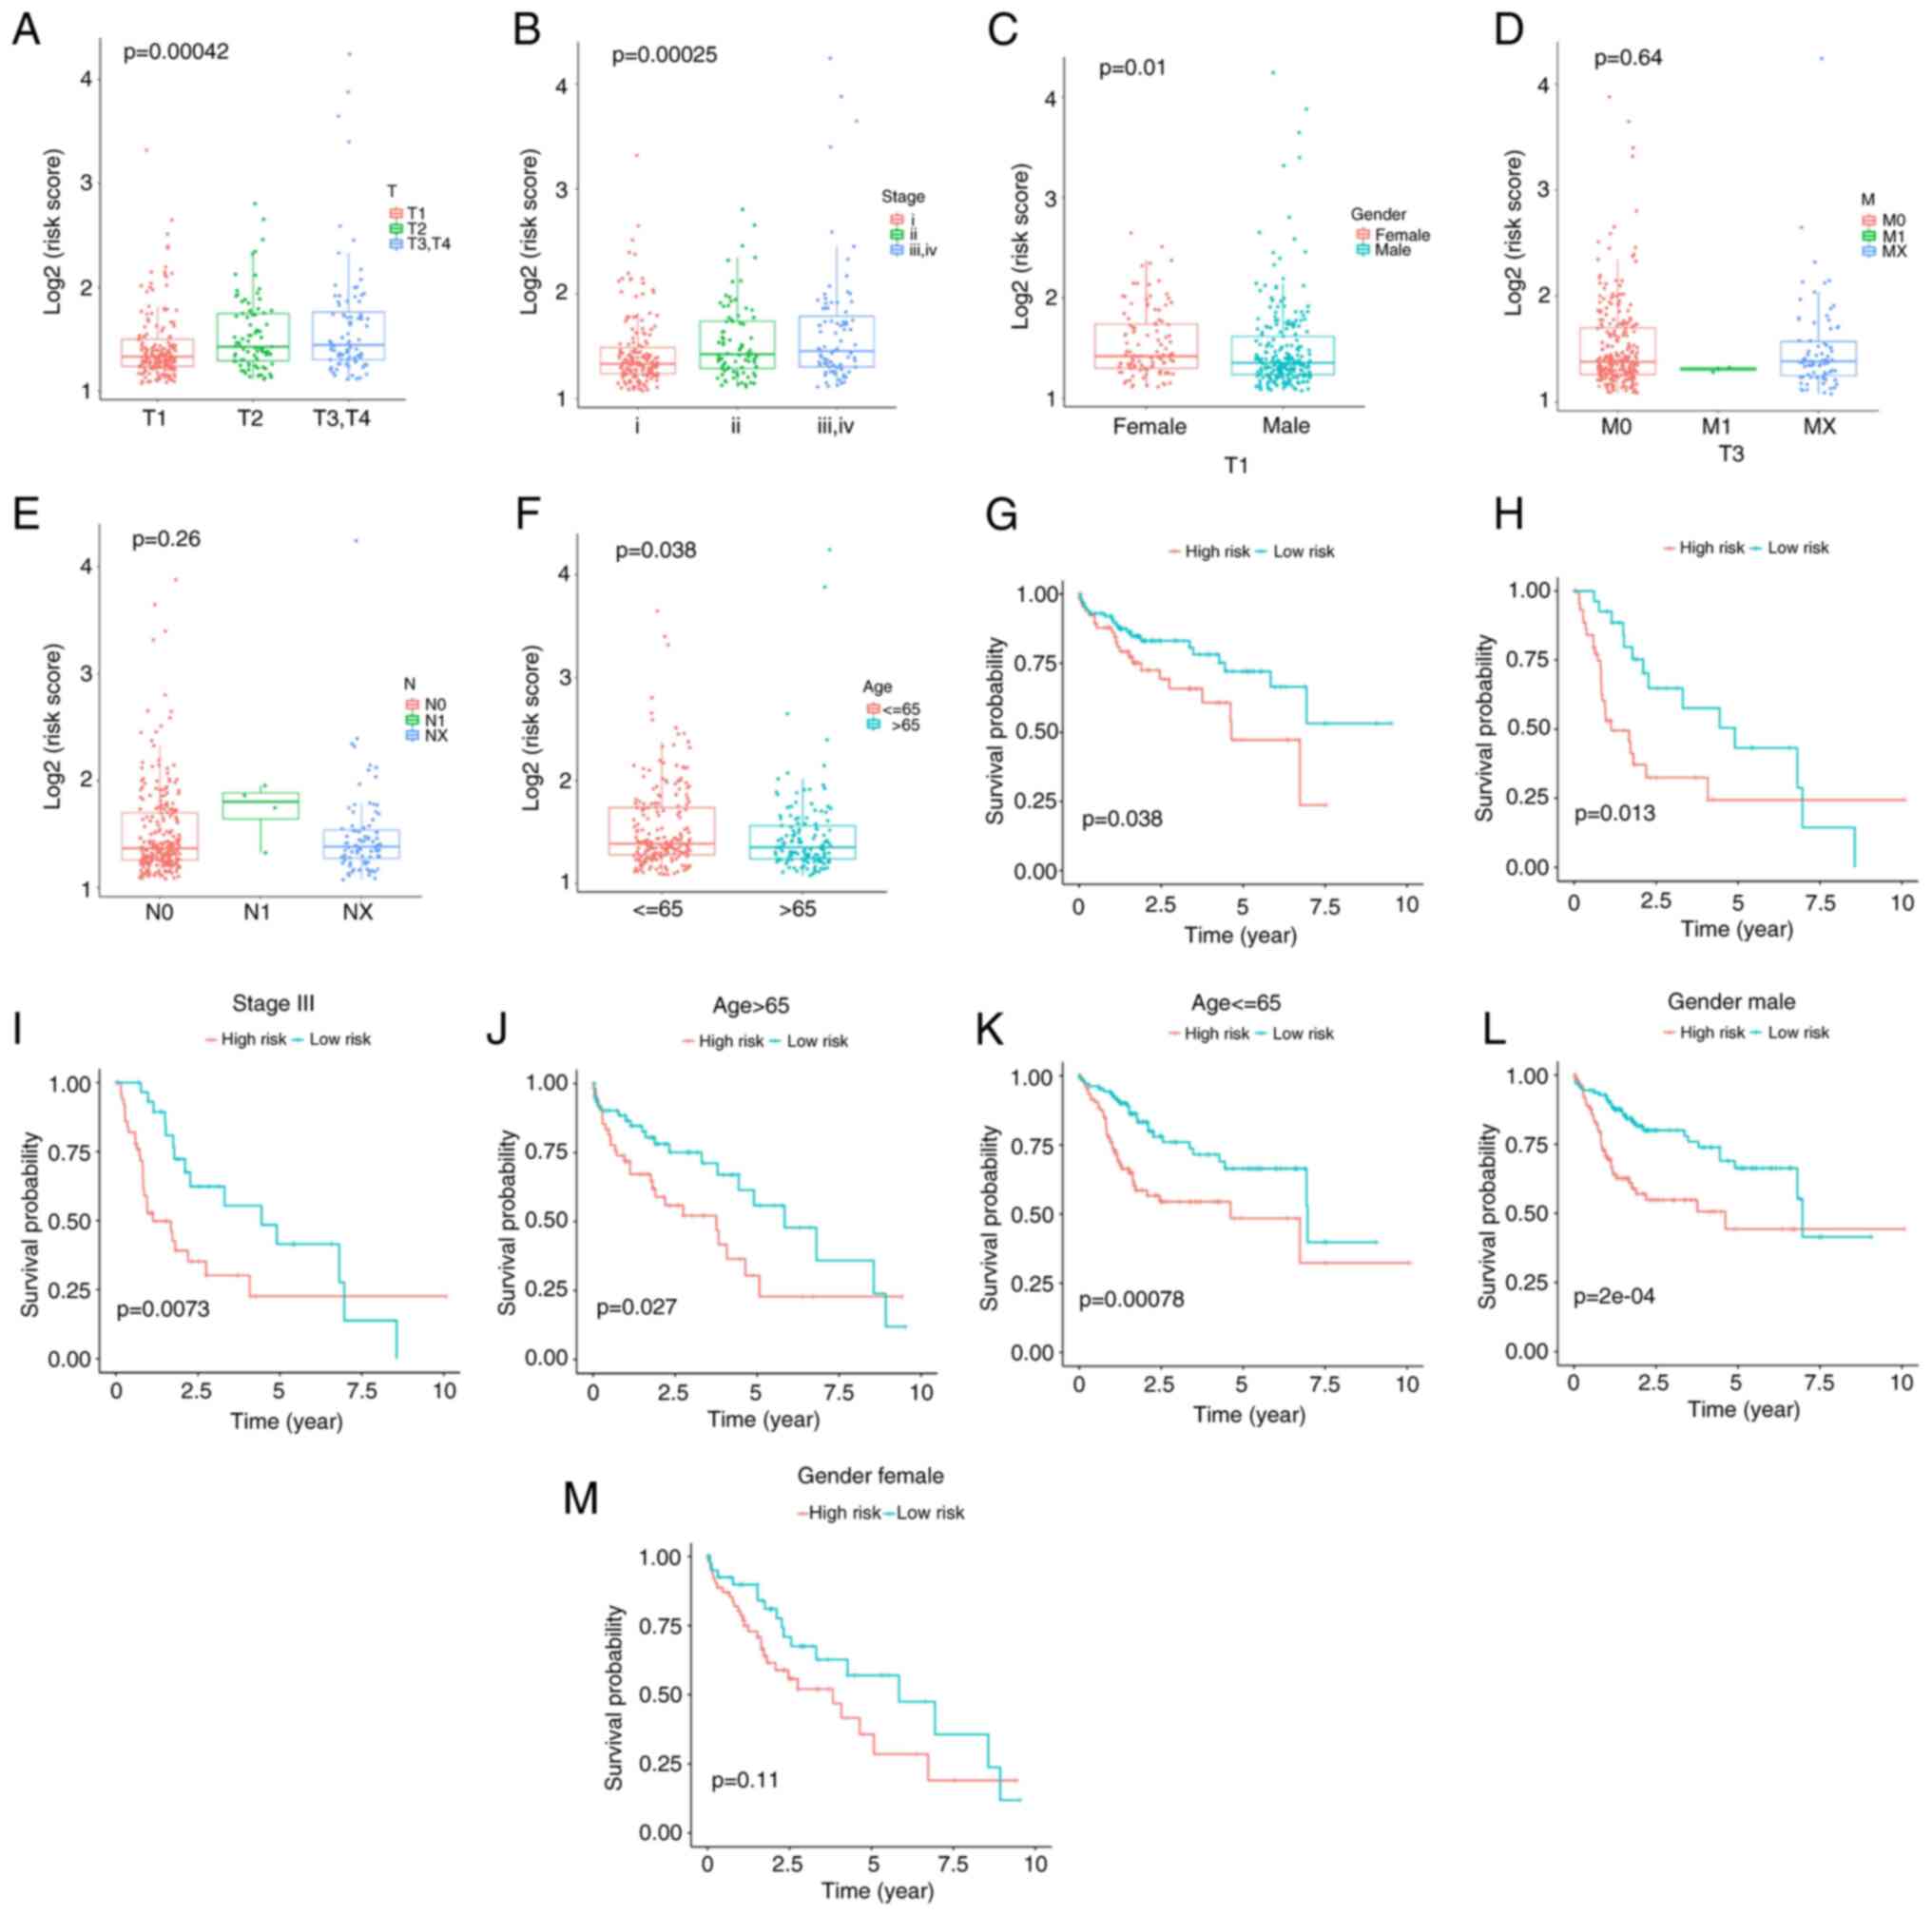
To determine whether clinicopathological features are associated with risk scores, association analysis was performed. The results showed that the risk score was correlated with TNM stage, gender and age (P<0.05; Fig. 4A-F). In order to better evaluate the prognostic ability of the risk model, hierarchical analysis was conducted to determine whether the risk model can predict the prognosis of different subgroups. The results showed that compared with low-risk patients, high-risk patients with the following clinicopathological characteristics had a poor prognosis: T1, T3, age >65 or age ≤65 years, stage 3 and male gender (Fig. 4G-M).
Enrichment analysis of DEGs in the high- and low-risk groups
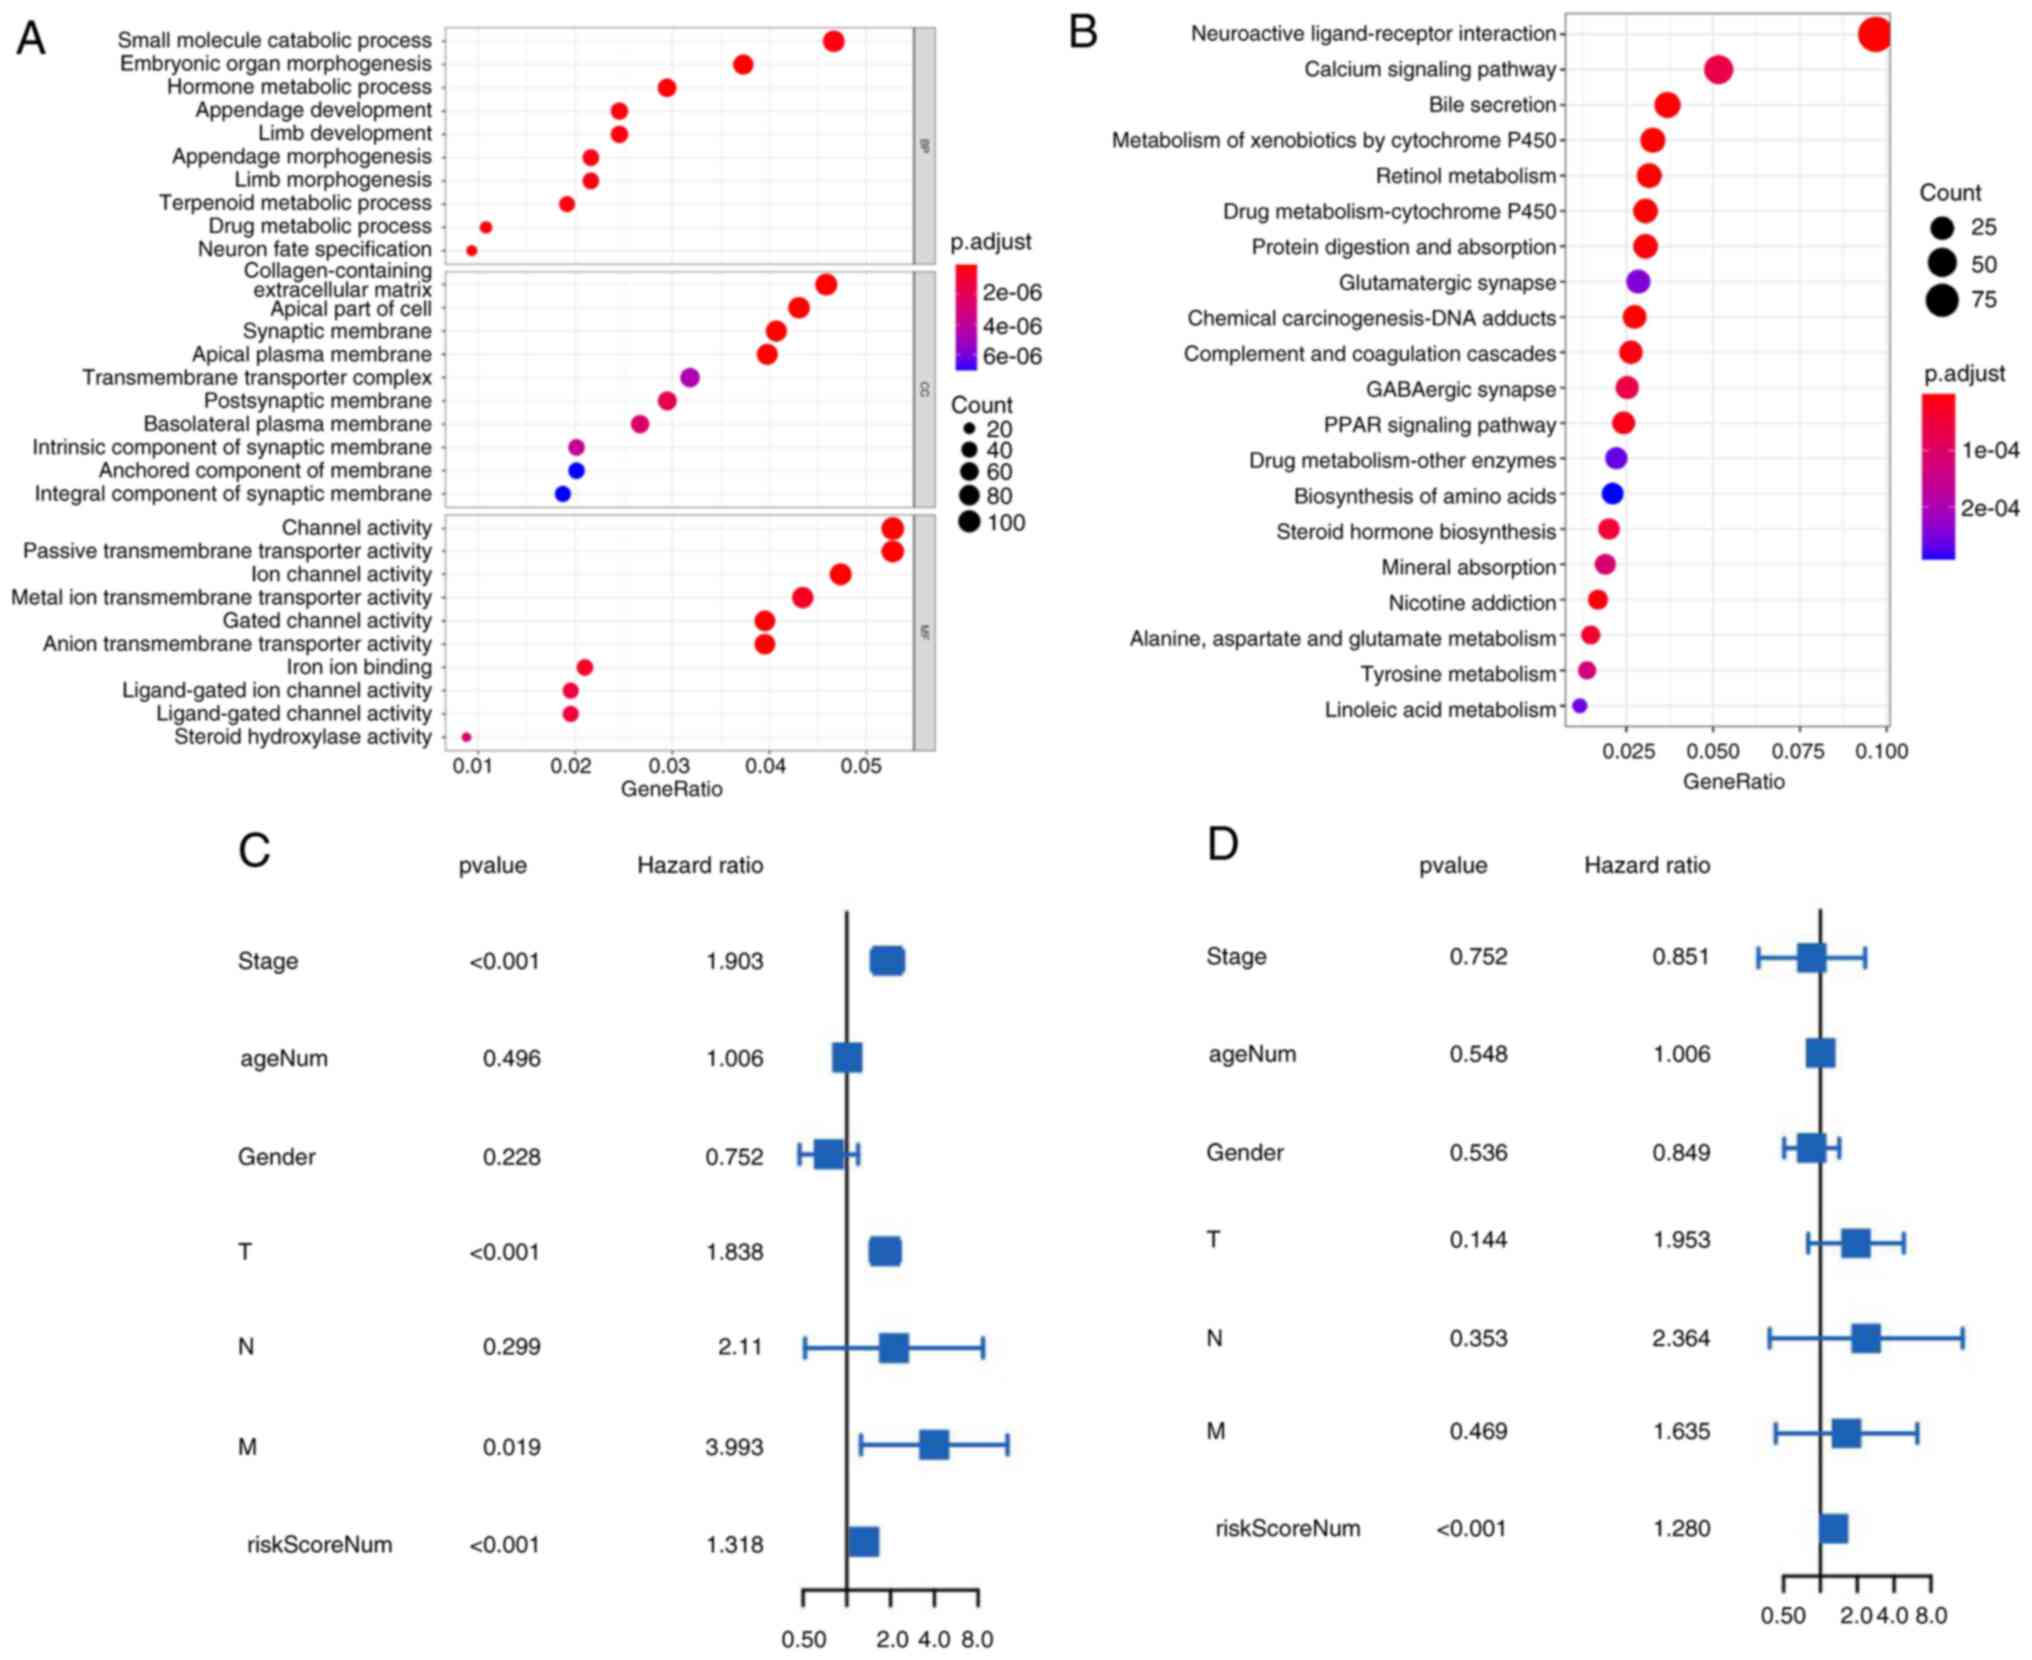
The aim of the present study was to determine the potential biological processes and pathways of molecular heterogeneity between the low- and high-risk subgroups. Using P<0.05 and log2F old Change >1 as the screening criteria, 2,352 DEGs between the high- and low-risk groups were identified. KEGG analysis of these DEGs showed that they were mainly enriched in ‘neuroactive ligand-receptor interaction’, ‘calcium signaling pathway’, ‘bile secretion’, ‘metabolism of xenobiotics by cytochrome P450’ and ‘retinol metabolism’ (Fig. 5A). GO enrichment analysis showed that they were mainly enriched in biological process terms of ‘small molecule process’, ‘embryonic organ morphogenesis’ and ‘hormone metabolic process’, cellular component terms of ‘collagen-containing extracellular matrix’, ‘apical part of cell’ and ‘synaptic membrane’ and molecular function terms of ‘channel activity’, ‘passive transmembrane transporter activity’ and ‘ion channel activity’ (Fig. 5B); These results may provide some clues for us to understand the cell biology-related effects of different genes in the high- and low-risk groups.
The risk score model is an independent prognostic factor for patients with liver cancer
To assess whether the risk score is an independent prognostic factor in patients with liver cancer, the data of liver cancer patients from the TCGA dataset were analyzed. The results of the univariate Cox regression analysis indicated that the risk score model was significantly associated with the OS hazard ratio (HR: 1.318; P<0.001), multivariate Cox regression analysis further showed that the risk scoring model was an independent predictor of OS (HR: 1.280, P<0.001; Fig. 5C and D). These results further suggested that the risk scoring model can be used as an independent prognostic factor, which may be helpful for the evaluation of clinical prognosis.
Construction of ceRNA network and gene function enrichment analysis
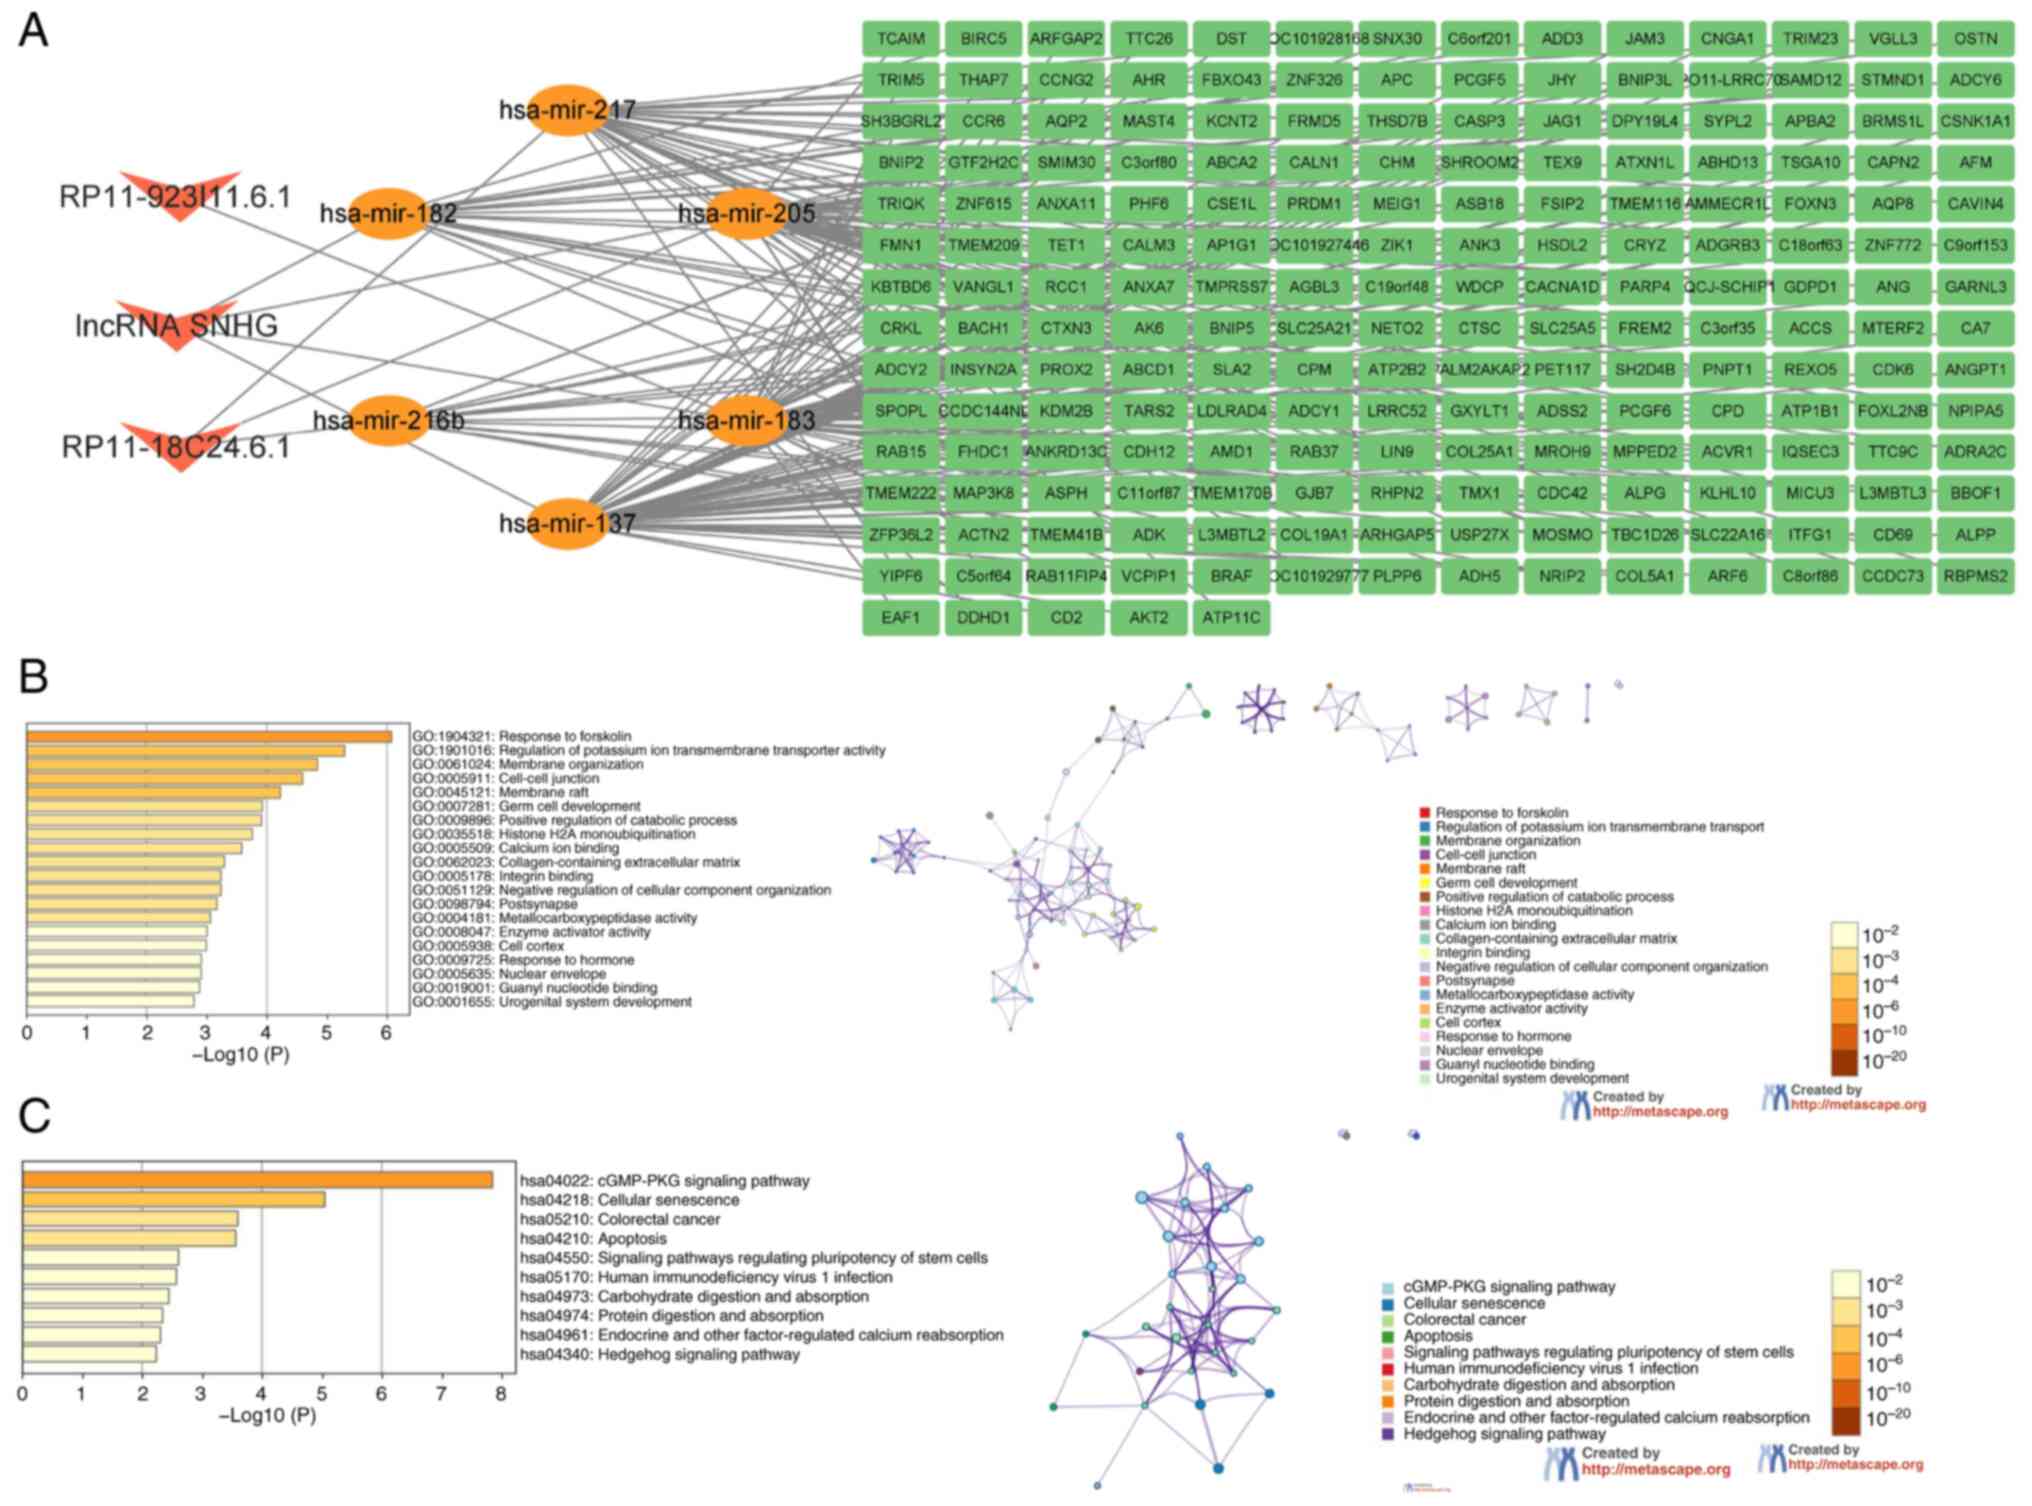
In order to further clarify the m6A-related lncRNAs, sponge miRNAs and regulated mRNA in hepatocellular carcinoma, a ceRNA network was constructed based on m6A-related lncRNAs. The miRNAs targeted by nine lncRNAs were predicted from the miRcode database; 3/9 lncRNAs were extracted (DYNLL1-AS1, RP1-228H13.5 and RP11-923I11.6), and 91 pairs of interactions between 3 lncRNAs and 74 miRNAs were identified. After intersecting the predicted miRNA with the differential miRNAs screened by sequencing, 6 intersecting miRNAs were obtained (hsa-miR-205, hsa-miR-216b, hsa-miR-217, hsa-miR-137, hsa-miR-182 and hsa-miR-183). Eight pairs of interactions between 3 lncRNAs and 6 miRNAs were identified. The target genes predicted by miRNA and the differential mRNAs screened by sequencing were crossed and 201 genes were obtained. Finally, a ceRNA network containing 3 lncRNAs, 6 miRNAs and 201 mRNAs was obtained (Fig. 6A). Due to the large number of genes regulated by RP1-228H13.5, which may be more important in liver cancer, the RP1-228H13.5/hsa-miR-205/ZIK1 signaling axis was selected for further research. GO enrichment analysis indicated that the 201 target genes were mainly concentrated in ‘response to forskolin’, ‘membrane transporter activity’, ‘membrane organization’ and ‘cell junction’; regarding KEGG pathways, target genes were mainly concentrated in the ‘cGMP/PKG signaling pathway’, ‘cellular sensitivity’, ‘colorectal cancer’ and ‘apoptosis’ (Fig. 6B and C).
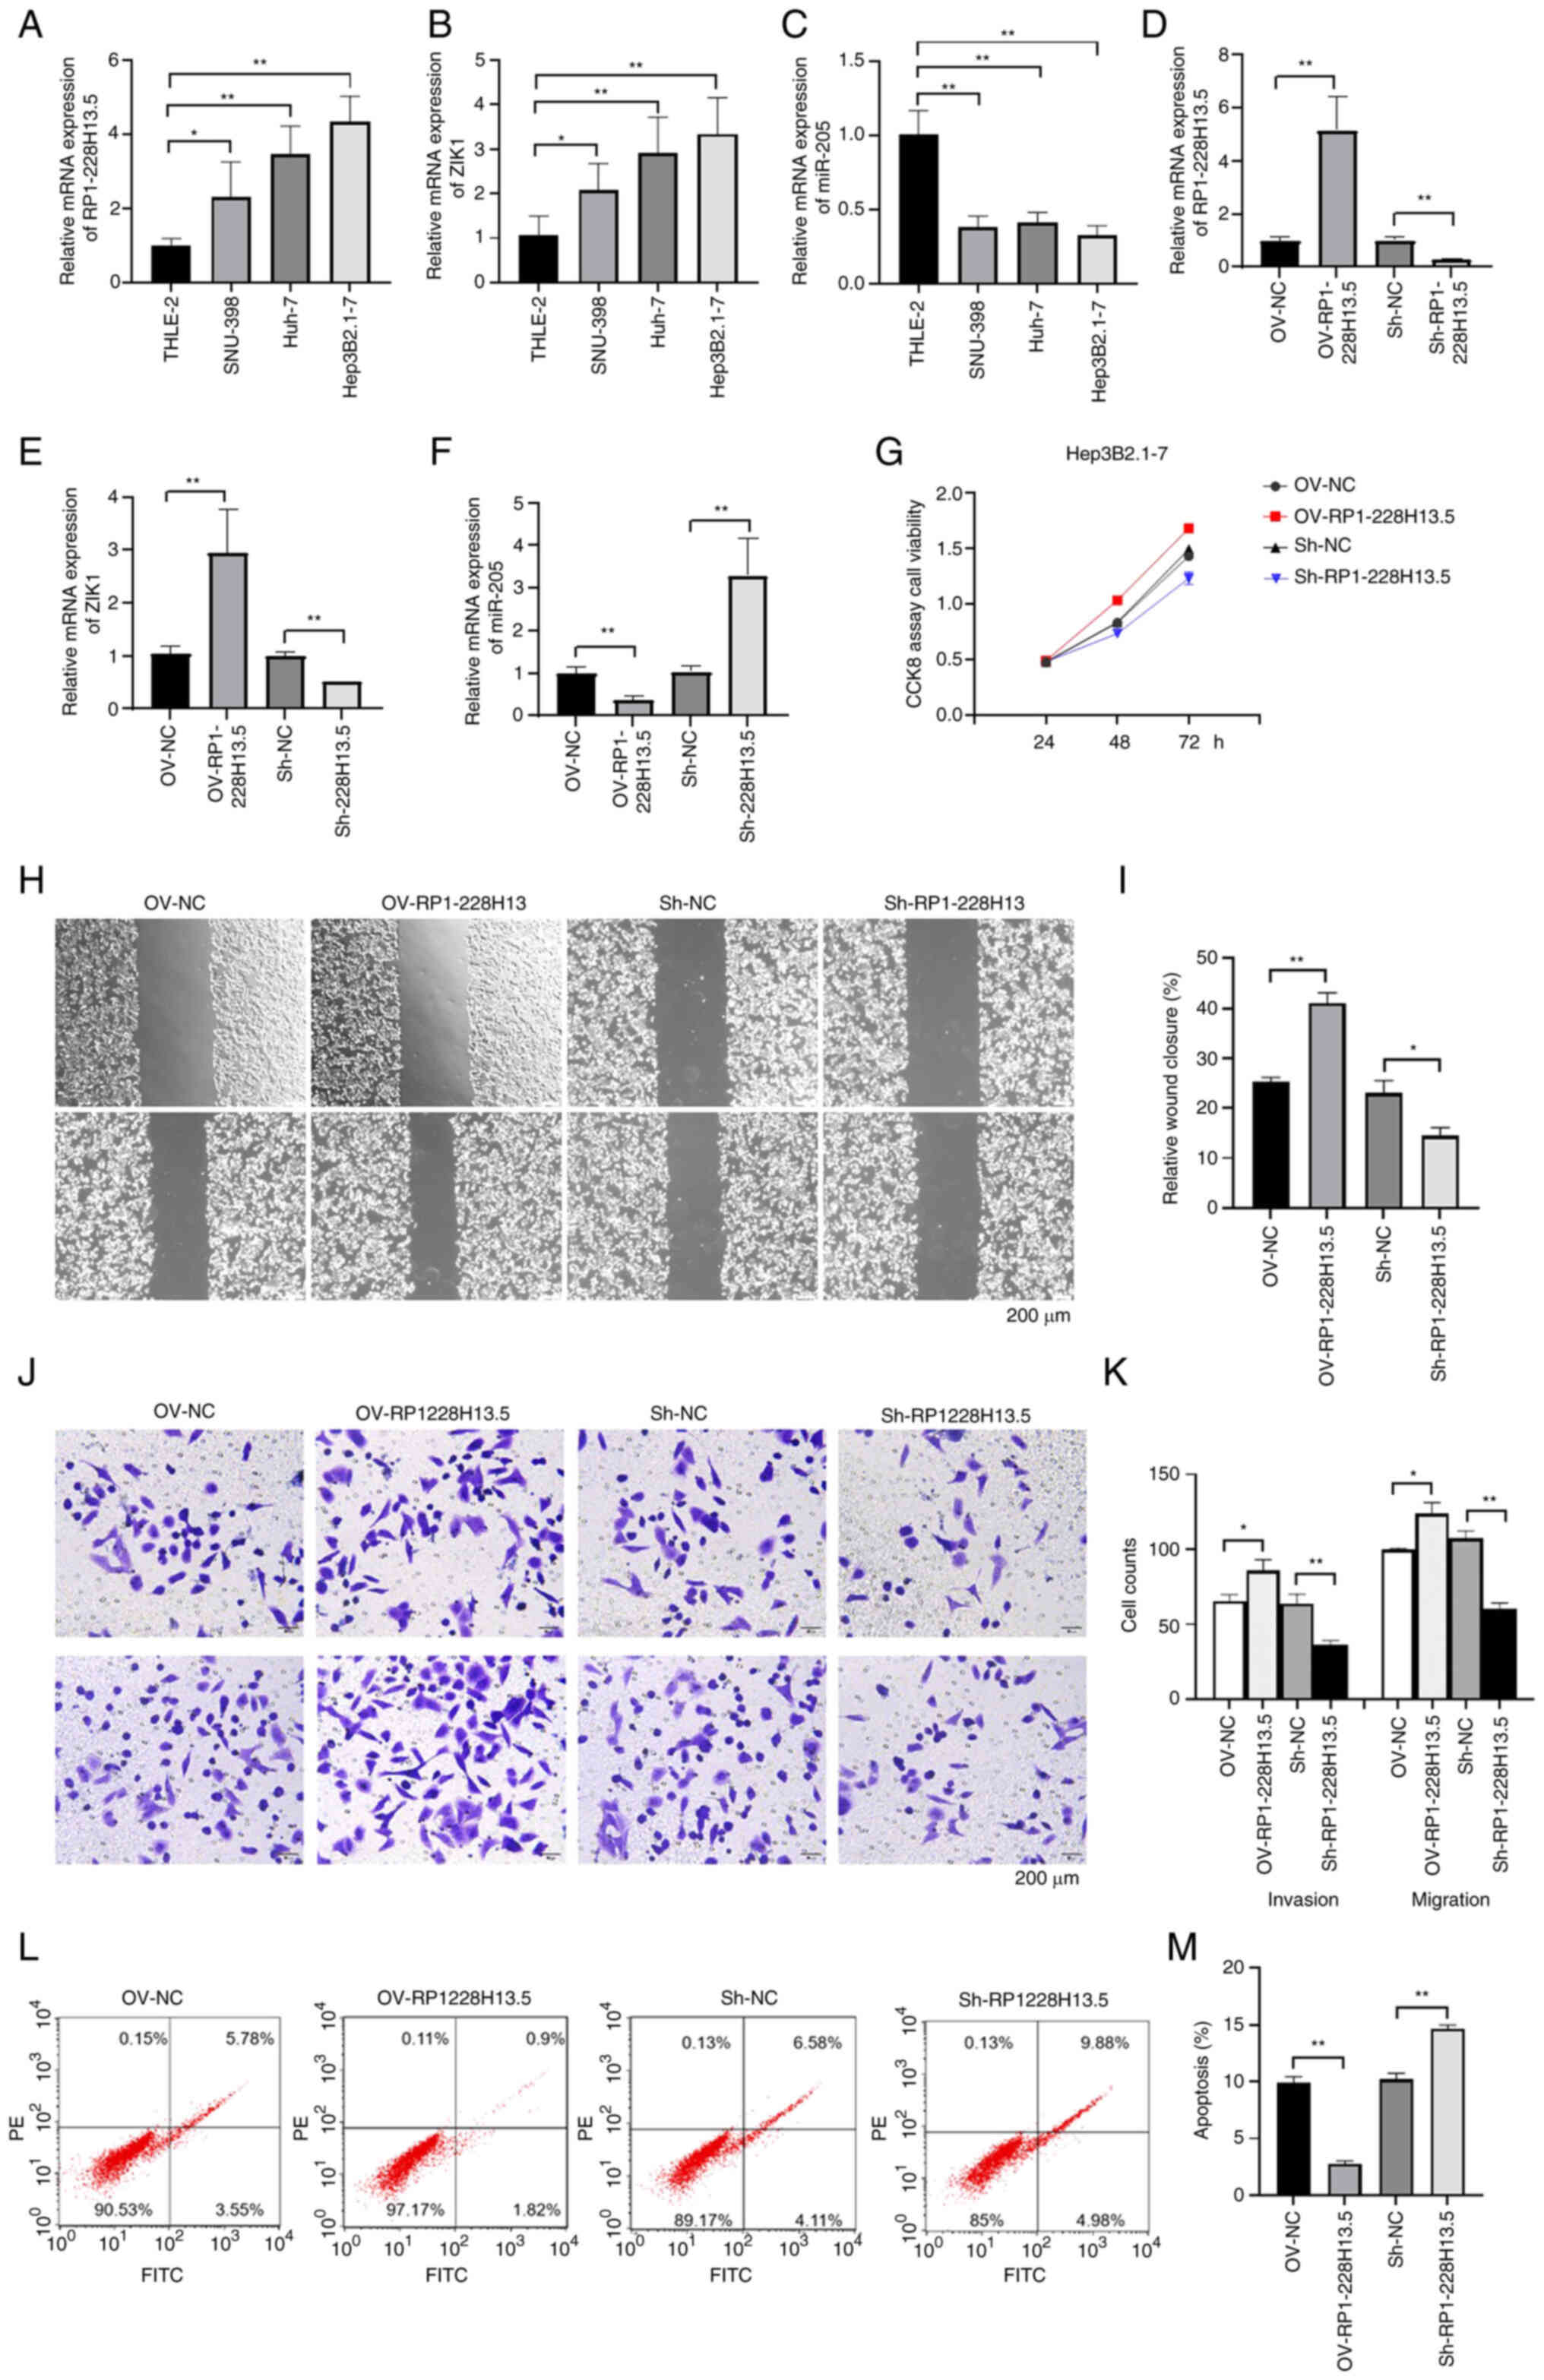
Expression of m6A methylation-related RP1-228H13.5 in liver cancer cells and its impact on cancer cell proliferation, migration, invasion and apoptosis. RT-qPCR was used to detect the expression levels of RP1-228H13.5, miR-205-5p and ZIK1 in normal and liver cancer cells. The results showed that RP1-228H13.5 and ZIK1 were significantly upregulated in liver cancer cell lines compared with THLE-2 cells (P<0.05), while miR-205-5p was significantly downregulated in liver cancer cell lines (P<0.05; Fig. 7A-C). After overexpressing and knocking down RP1-228H13.5 in cells, the expression levels of RP1-228H13.5, miR-205-5p and ZIK1 were detected. The results showed that after overexpressing RP1-228H13.5, RP1-228H13.5 and ZIK1 were significantly upregulated (P<0.05), while miR-205-5p was significantly downregulated (P<0.01; Fig. 7D-F). The effects of RP1-228H13.5 on the proliferation, migration, invasion and apoptosis of liver cancer cells were further investigated through cell experiments. The results of the CCK-8 assay showed that RP1-228H13.5 overexpression promoted the proliferation of Hep3B2.1–7 cells, while knockdown of RP1-228H13.5 inhibited the proliferation of Hep3B2.1–7 cells (Fig. 7G). The results of the wound-healing assay showed that RP1-228H13.5 overexpression promoted the migration of Hep3B2.1–7 cells, while RP1-228H13.5 knockdown inhibited it (Fig. 7H and I). Transwell assay results showed that RP1-228H13.5 overexpression promoted the migration and invasion of Hep3B2.1–7 cells, while RP1-228H13.5 knockdown inhibited them (Fig. 7J and K). The results of the cell apoptosis assay showed that RP1-228H13.5 overexpression inhibited Hep3B2.1–7 cell apoptosis, while RP1-228H13.5 knockdown promoted Hep3B2.1–7 cell apoptosis (Fig. 7L and M). The above results indicated that RP1-228H13.5 promotes the proliferation, migration and invasion of Hep3B2.1–7 cells and inhibits their apoptosis.
RP1-228H13.5 can target miR-205-5p to regulate ZIK1 expression
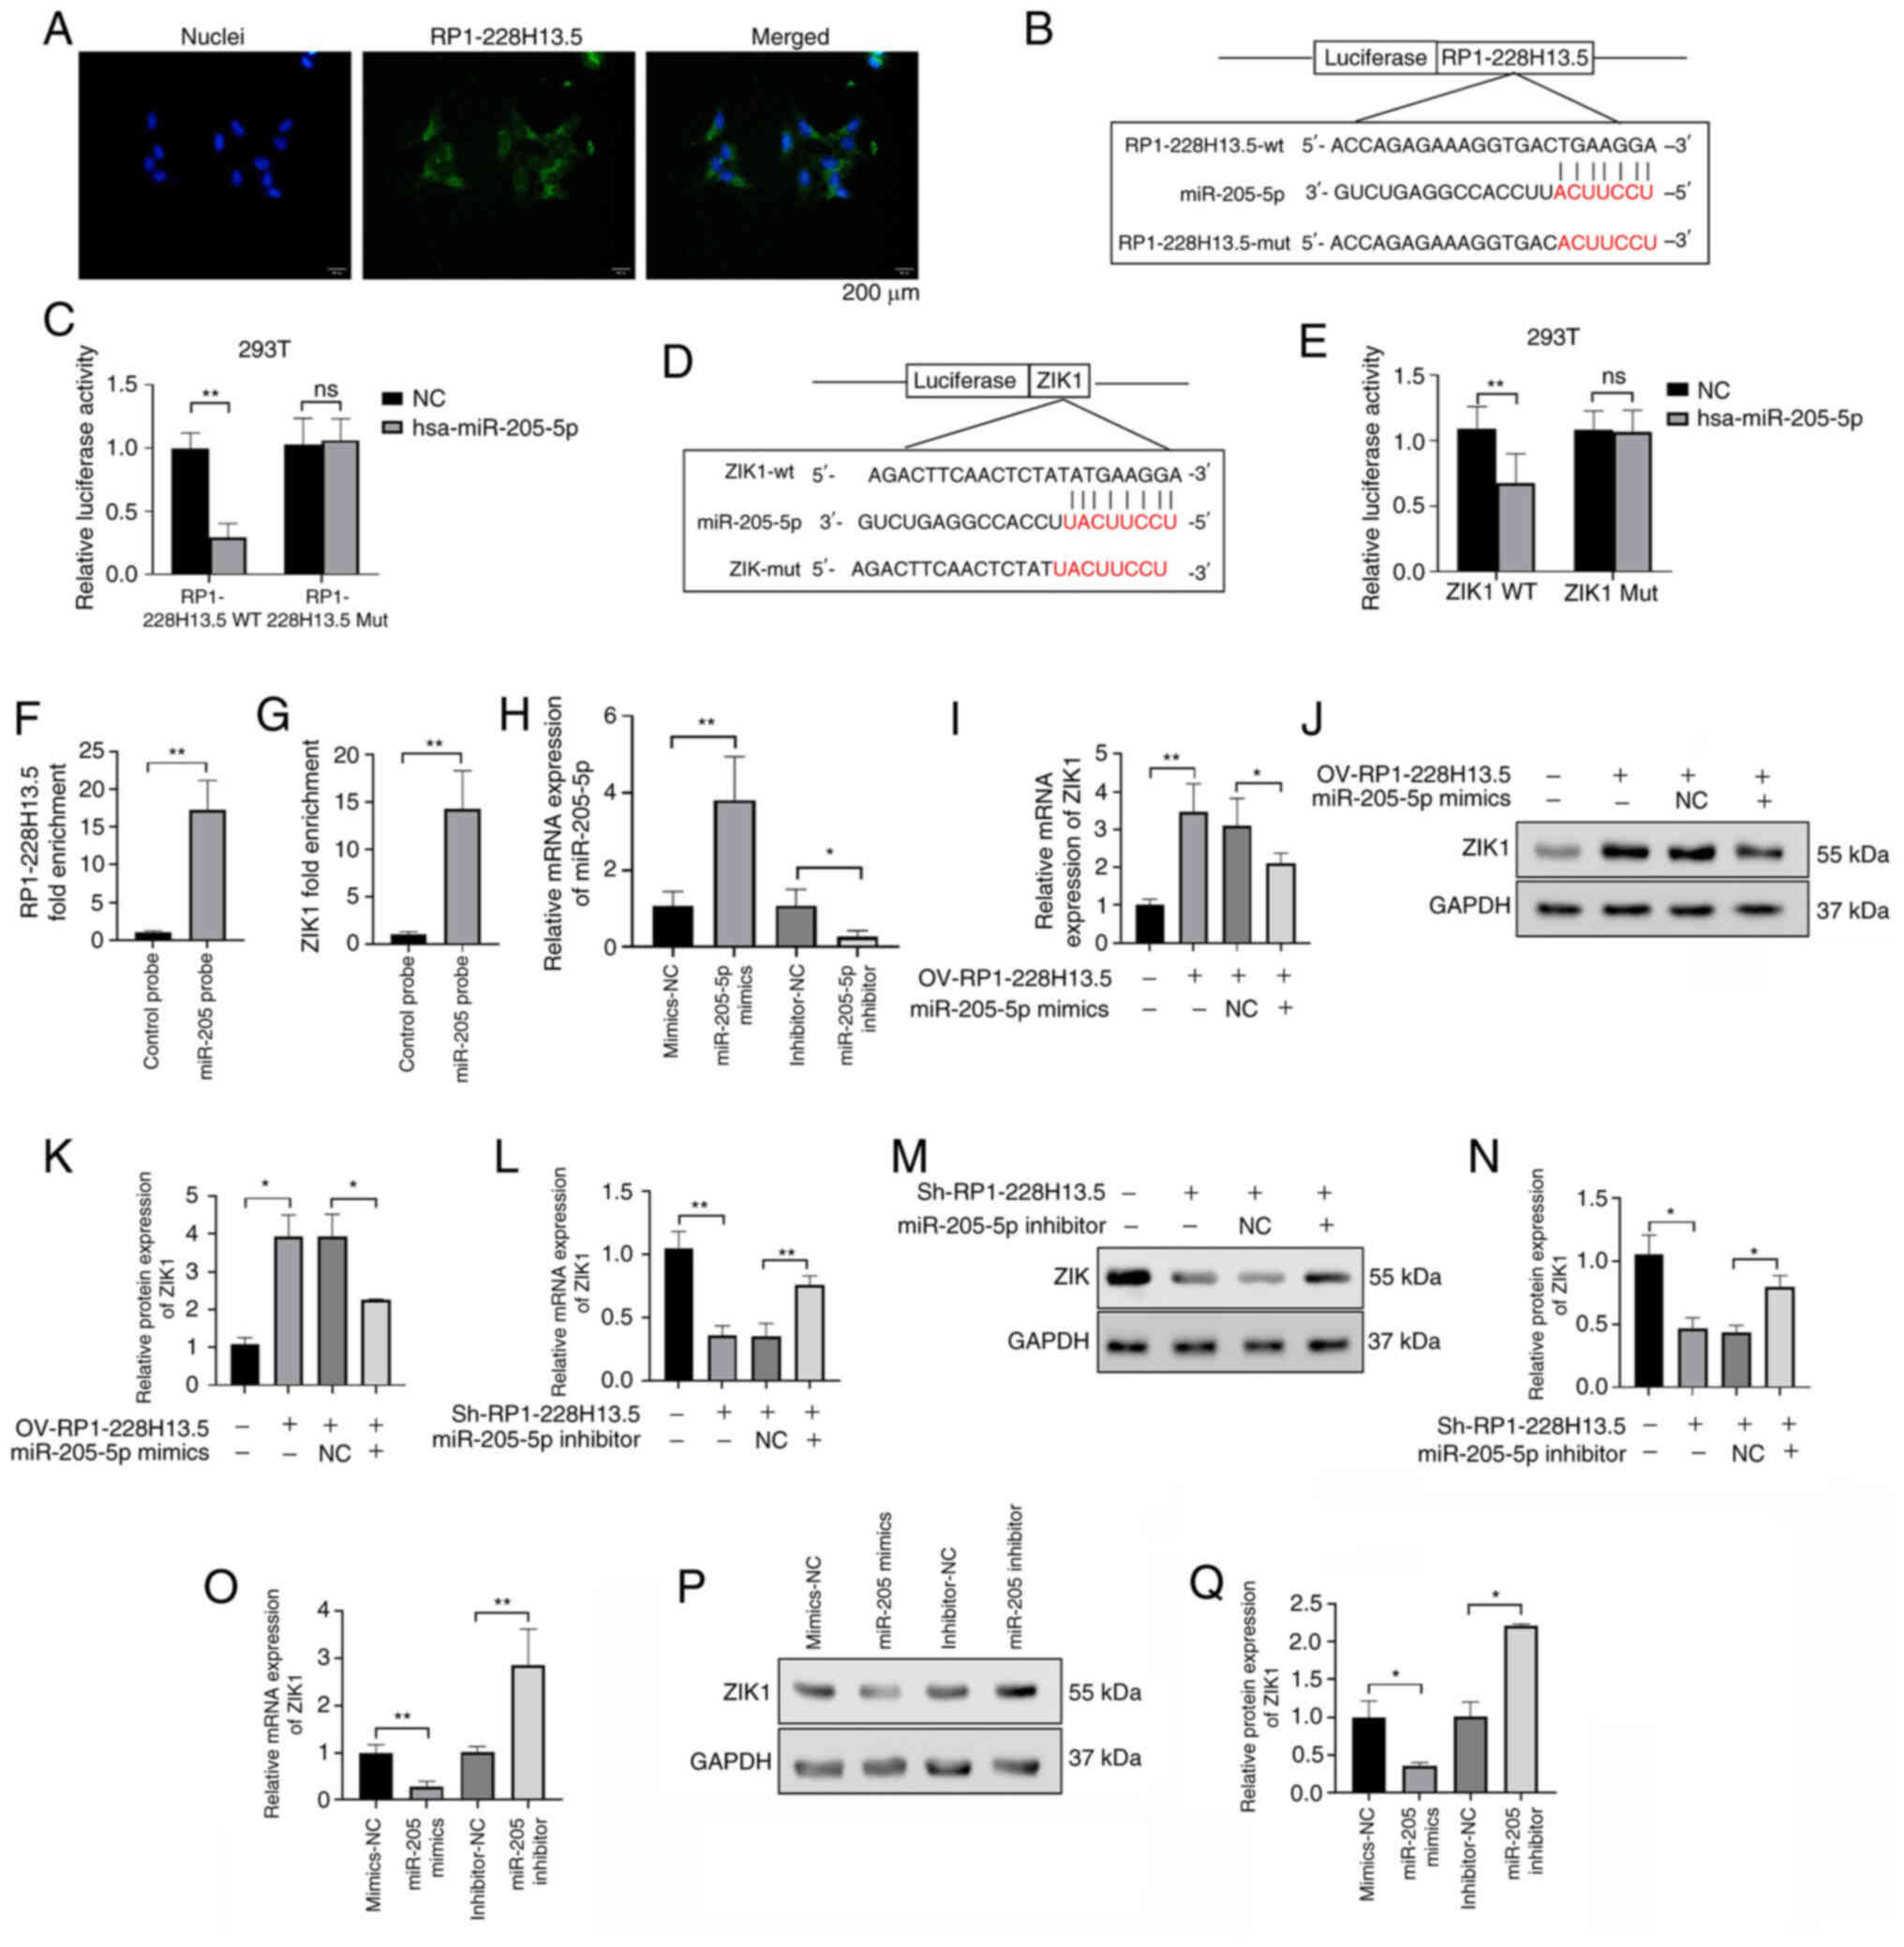
FISH is an accurate method for determining the localization of RNA in cells. In this experiment, liver cancer cell lines were collected and cultured for FISH to determine the cell localization of RP1-228H13.5. The results showed that RP1-228H13.5 was localized in the nucleus of liver cancer cell lines (Fig. 8A). The binding sites of RP1-228H13.5 and miR-205-5p were predicted using the Starbase 2.0 database, as presented in Fig. 8B. The results of the dual luciferase assay showed that following miR-205-5p overexpression, the luciferase activity of RP1-228H13.5-wt was significantly reduced (P<0.05), while the relative value of the luciferase activity of RP1-228H13.5-mut showed no significant change (P>0.05; Fig. 8C), indicating that RP1-228H13.5 is able to regulate miR-205-5p. The database predicted the binding site between miR-205-5p and ZIK1, as presented in Fig. 8D. The results of the dual luciferase assay showed that following miR-205-5p overexpression, the activity of ZIK1-wt luciferase significantly decreased (P<0.05), while the relative value of ZIK1-mut luciferase activity did not change significantly (P>0.05; Fig. 8E), indicating that miR-205-5p can regulate ZIK1. An RNA pull-down assay was also conducted to confirm the binding of miR-205-5p to RP1-228H13.5 and ZIK1. The results showed that compared with the control probe group, the fold enrichment of RP1-228H13.5 and ZIK1 in the miR-205-5p probe group was significantly increased, indicating that miR-205-5p can bind to RP1-228H13.5 and ZIK1 (Fig. 8F and G). The RT-qPCR assay results showed that overexpression of miR-205-5p significantly increased the expression level of miR-205-5p; after knocking down miR-205-5p, the expression level of miR-205-5p significantly decreased, indicating successful transfection of miR-205-5p in Hep3B2.1–7 cells (Fig. 8H). To further clarify the regulatory relationship between miR-205-5p and RP1-228H13.5 and ZIK1, OV-RP1-228H13.5 alone or with miR-205-5p mimics were transfected into cells to detect the expression level of ZIK1. The results showed that, compared with the NC control group, the expression of ZIK1 was significantly promoted in the OV-RP1-228H13.5 group, while compared with the OV-RP1-228H13.5 group, co-transfection of OV-RP1-228H13.5 and miR-205-5p mimics significantly reduced the expression level of ZIK1 (Fig. 8I-K). Following the transfection of cells with Sh-RP1-228H13.5 alone or with miR-205-5p inhibitor, the expression level of ZIK1 was detected. The results showed that, compared with the NC control group, the expression of ZIK1 was significantly inhibited in the Sh-RP1-228H13.5 group, while, compared with the Sh-RP1-228H13.5 group, co-transfection of Sh-RP1-228H13.5 and miR-205-5p inhibitor significantly increased the expression level of ZIK1 (Fig. 8L-N). The above results suggested that miR-205-5p can reverse the effect of Sh-RP1-228H13.5 on the expression of ZIK1. To clarify the effect of miR-205-5p on the expression of ZIK1, ZIK1 expression was detected following the overexpression and knockdown of miR-205-5p. The results showed that, as compared with the NC group, the expression of ZIK1 was significantly inhibited in the miR-205-5p mimics group, while it was significantly promoted in the miR-205-5p inhibitor group (Fig. 8O-Q). The above study suggested that Sh-RP1-228H13.5 can target miR-205-5p to regulate the expression level of ZIK1.
m6A methyltransferase METTL14 mediates the regulation of miR-205-5p expression by RP1-228H13.5
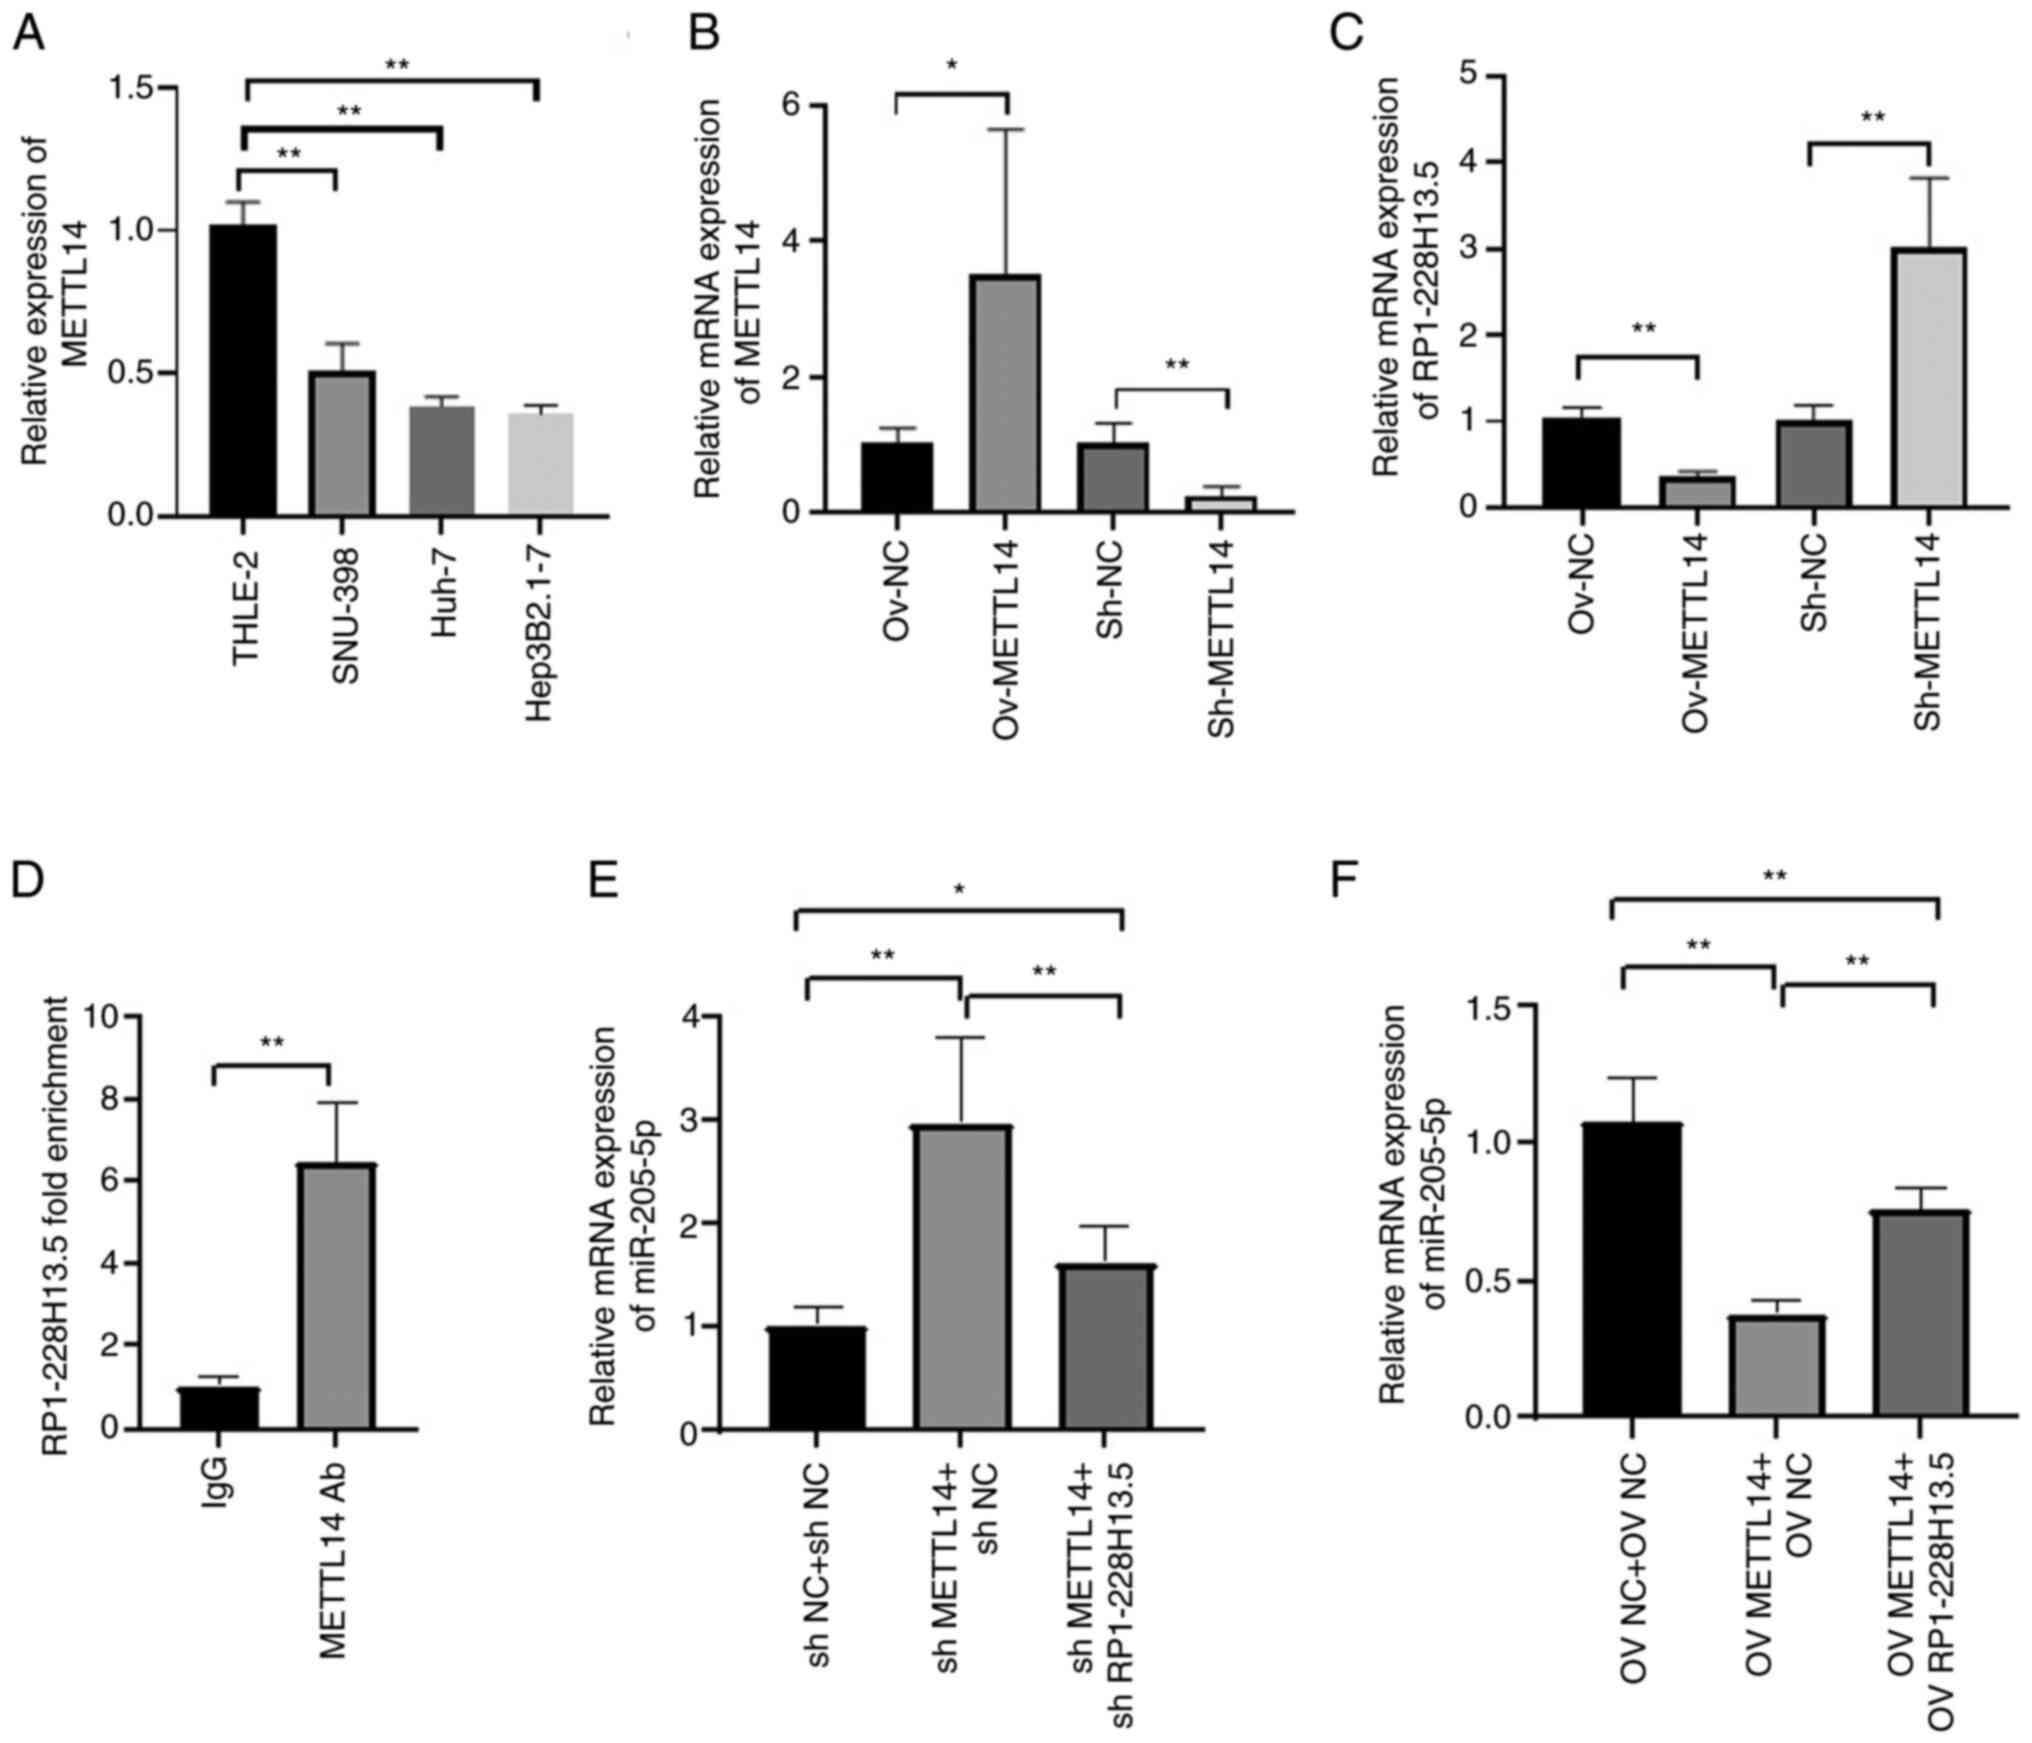
RT-qPCR detection of METTL14 expression levels in normal and liver cancer cells showed that METTL14 was significantly downregulated in liver cancer cell lines compared with THLE-2 cells (P<0.05; Fig. 9A). The RT-qPCR assay results showed that overexpression of METTL14 significantly increased the expression of METTL14; after knocking down METTL14, the expression level of METTL14 significantly decreased, indicating successful transfection of METTL14 and its inhibitor in Hep3B2.1–7 cells (Fig. 9B). To investigate the regulatory effect of m6A methyltransferase METTL14 on RP1-228H13.5, METTL14 was overexpressed or knocked down. The results showed that METTL14 overexpression inhibited the expression of RP1-228H13.5, while knocking down METTL14 promoted the expression of RP1-228H13.5 (Fig. 9C). A further RNA pull-down assay confirmed that METTL14 can bind to RP1-228H13.5 (Fig. 9D). The cells were co-transfected with shMETTL14 or shMETTL14 + sh-RP1-228H13.5. RT-qPCR assay was performed to detect the expression of miR-205-5p. The results showed that knockdown of METTL14 impaired the promoting effect of shRP1-228H13.5 on miR-205-5p in cells (Fig. 9E). After co-transfecting cells with OV-METTL14 or OV-METTL14 + OV-RP1-228H13.5, the expression of miR-205-5p was also detected by RT-qPCR assay. The results showed that METTL14 upregulation impaired the inhibitory effect of OV-RP1-228H13.5 on miR-205-5p in cells (Fig. 9F). The above results suggested that m6A methyltransferase METTL14 mediates the regulation of miR-205-5p expression by RP1-228H13.5.
Discussion
m6A methylation modification of RNA is a common modification after transcription in eukaryotes (12). It is reported in the literature that ~20% of human mRNA can be modified by conventional methylation. m6A is often located near the stop codon of mRNA. It has been determined that >7,000 different mRNA molecules have m6A methylation modification (13), which means that m6A modification may widely affect gene expression. m6A methylation-modified RNA can change the structure of RNA by weakening base pairing, increasing protein binding recognition sites and recruiting protein complexes to participate in cell biology processes, including mRNA splicing, RNA output, stability and immune tolerance (14,15). It was found that m6A methylation can also modify lncRNA and affect its stability and metabolism (16). m6A regulators can maintain the malignancy of a variety of tumors by modifying specific lncRNAs. METTL3 promotes liver cancer progression through YTHDF2-dependent post-transcriptional silencing of SOCS2 (17); METTL16 promotes the progression of hepatocellular carcinoma by downregulating RAB11B-AS1 in an m6A-dependent manner (18); the ALKBH5/MAP3K8 axis can promote the progression of hepatocellular carcinoma by regulating PD-L1 and macrophage infiltration (19); HIF-1α induces YTHDF1 to promote the translation of ATG2A and ATG14 to drive hypoxia-induced autophagy and malignancy of hepatocellular carcinoma (20); YTHDF2 regulates OCT4 expression through m6A RNA methylation, promoting liver cancer cell phenotype and cancer metastasis (21); YTHDF3 mediates m6A modification and PFKL as a functional loop in glycolysis in hepatocellular carcinoma (22); lncRNA PCAT6 regulates the miR-326/HNRNPA2B1 axis in liver cancer and promotes proliferation and invasion of liver cancer cells (23); IGF2BP1 regulates the stability of MGAT5 mRNA and promotes the phenotype of liver cancer stem cells (24); IGF2BP2 promotes the growth of liver cancer cells through a m6A-FEN1-dependent mechanism (25); ALKBH5-mediated m6A demethylation of the lncRNA RMRP has a carcinogenic role in lung adenocarcinoma (26). ALKBH5 can upregulate the expression of lncRNA NEAT1 through demethylation and inhibit the malignant behavior of colon cancer (27). LCAT3 is a novel m6A-regulated lncRNA that activates c-MYC by binding to FUBP1 and has a carcinogenic role in lung cancer (28). It has been shown that m6A-modified lncRNAs can affect the occurrence and development of tumors, and lncRNAs may act as ceRNAs to target m6A regulators, thus affecting the invasive progression of tumors. In summary, it is indicated that m6A is modified to target lncRNAs, and accordingly, increased attention should be paid to the interactions and functions of lncRNAs and m6A modifications to determine potential tumor prognostic markers or treatment targets.
In the present study, 374 patients with liver cancer from the TCGA dataset were included to explore the prognosis of m6A-related lncRNAs. The prognostic value of 89 m6A-related lncRNAs was confirmed and nine of them were used to establish a risk model to predict the OS of patients with liver cancer, including CTD-2510F5.4, CTD-2012J19.3, SNHG4, RP1-228H13.5, RP11-443B20.1, DYNLL1-AS1 RP11-498C9.15, RP11-923i11.6 and RP11-817I4.1. The established ceRNA network identified the RP1-228H13.5/hsa-miR-205/ZIK1 signaling axis for subsequent research, of which RP1-228H13.5 has not been reported in previous studies. In the present study, it was found that RP1-228H13.5 is significantly upregulated in liver cancer and can promote the proliferation, migration and invasion of liver cancer cells, while inhibiting cell apoptosis. The above results suggest that RP1-228H13.5 is a tumor-promoting gene in liver cancer. The Starbase database confirmed that RP1-228H13.5 can be combined with miR-205-5p. Research has found that miR-205-5p has an important role in the invasion and migration of liver cancer and that is has a promoting role in various malignant tumors, such as gastric cancer (29), colon cancer (30) and non-small cell lung cancer (31), participating in tumor invasion and migration. Previous studies have found that miR-205-5p is a key regulatory factor for VEGFA in liver cancer-related angiogenesis (32) and YB1 regulates the miR-205/200b-ZEB1 axis by inhibiting the maturation of miRNAs in liver cancer (33). DNAJA1 stabilizes EF1A1 and promotes miR-205-5p-mediated cancer cell proliferation and metastasis (34). miR-205-5p regulates the chemotherapeutic resistance of hepatocellular carcinoma cells by targeting the PTEN/JNK/ANXA3 pathway (35). The database confirmed that ZIK1 can be combined with hsa-miR-205. ZIK1 was initially considered a transcription inhibitor that binds to nuclear RNA protein particle K protein (36,37) and exhibits high methylation in gastrointestinal metaplasia (38). Abnormal expression of ZIK1 is associated with the occurrence of renal cell carcinoma (39), diffuse large B-cell lymphoma (39), esophageal cancer (40), colorectal cancer and gastric cancer (41). Previous studies have also found that miR-197-3p may partially regulate hepatocellular carcinoma survival by downregulating ZIK1. Therefore, the miR-197-3p/ZIK1 axis may serve as a new therapeutic target for patients with liver cancer (42). The present study found that m6A methylation-related RP1-228H13.5 can target and bind with hsa-miR-205 to regulate the expression of ZIK1.
Our research team is interested in the METTL14 gene and has previously found that METTL14 may regulate the expression of RP1-228H13.5. Therefore, METTL14 was selected for subsequent analysis. Other m6A-related genes will be our future research endeavor. Research has also found that METTL14 can regulate the expression of RP1-228H13.5. METTL14 is an important m6A methylase that has a key role in the m6A methylation process of RNA, and has also been found to have a role in the occurrence or development of various tumors (43). It was reported that METTL14 inhibits the potential metastatic ability of hepatocellular carcinoma by regulating m6A methylation-dependent miRNA processes (44). Lin et al (45) found a decrease in METTL14 expression in lung cancer tissue, but to date, its function in lung cancer has not been well studied. The present study found that METTL14 can mediate the regulation of miR-205-5p expression by RP1-228H13.5.
In the present study, bioinformatics and statistical analyses were conducted on relevant data of patients with cancer from the TCGA database to determine the prognostic significance of m6A-related lncRNAs. An RP1-228H13.5/hsa-miR-205/ZIK1 signaling axis was identified. Finally, through cell experiments, it was determined that m6A methyltransferase METTL14 may mediate RP1-228H13.5 to promote the proliferation, migration, invasion and inhibition of liver cancer cell apoptosis by targeting hsa-miR-205/ZIK1, providing ideas for the study of targets and mechanisms of liver cancer occurrence and development. However, the present study only analyzed METTL14 and the data analyzed were from 2021, which is a limitation of this study. Further research will be conducted on other m6A-related genes in the future.
Acknowledgements
Not applicable.
Funding
Funding: No funding was received.
Availability of data and materials
The data generated in the present study may be requested from the corresponding author.
Authors' contributions
CL, KQ and FM conceived the study, planned and carried out experiments and were involved in data analysis and manuscript writing-reviewing and editing. JX, CL, KQ and YW conceived the study, planned and carried out experiments and were involved in data analysis and original draft preparation. JYZ and SL carried out experiments and performed data analysis. KQ and FM have checked and confirmed the authenticity of the raw data. All authors have read and approved the final manuscript.
Ethics approval and consent to participate
Not applicable.
Patient consent for publication
Not applicable.
Competing interests
The authors declare that they have no competing interests.
References
|
Siegel RL, Miller KD and Jemal A: Cancer statistics, 2019. CA Cancer J Clin. 69:7–34. 2019. View Article : Google Scholar : PubMed/NCBI | |
|
Ashtari S, Pourhoseingholi MA, Sharifian A and Zali MR: Hepatocellular carcinoma in Asia: Prevention strategy and planning. World J Hepatol. 7:1708–1717. 2015. View Article : Google Scholar : PubMed/NCBI | |
|
Gong B, Kao Y, Zhang C, Sun F and Zhao H: Systematic Investigation of scutellariae barbatae herba for treating hepatocellular carcinoma based on network pharmacology. Evid Based Complement Alternat Med. 2018:43657392018. View Article : Google Scholar : PubMed/NCBI | |
|
Du L, Li Y, Kang M, Feng M, Ren Y, Dai H, Wang Y, Wang Y and Tang B: USP48 is upregulated by Mettl14 to attenuate hepatocellular carcinoma via regulating SIRT6 stabilization. SIRT6 stabilization. Cancer Res. 81:3822–3834. 2012. View Article : Google Scholar : PubMed/NCBI | |
|
Cheng X, Li M, Rao X, Zhang W, Li X, Wang L and Huang G: KIAA1429 regulates the migration and invasion of hepatocellular carcinoma by altering m6A modification of ID2 mRNA. Onco Targets Ther. 12:3421–3428. 2019. View Article : Google Scholar : PubMed/NCBI | |
|
Pan T: N6-methyl-adenosine modification in messenger and long non-coding RNA. Trends Biochem Sci. 38:204–209. 2013. View Article : Google Scholar : PubMed/NCBI | |
|
Tu Z, Wu L, Wang P, Hu Q, Tao C, Li K, Huang K and Zhu X: N6-methylandenosine-related lncRNAs are potential biomarkers for predicting the overall survival of lower-grade glioma patients. Front Cell Dev Biol. 8:6422020. View Article : Google Scholar : PubMed/NCBI | |
|
Zhang B, Wu Q, Li B, Wang D, Wang L and Zhou YL: m6A regulator-mediated methylation modification patterns and tumor microenvironment infiltration characterization in gastric cancer. Mol Cancer. 19:532020. View Article : Google Scholar : PubMed/NCBI | |
|
Zhang Z, Zhang C, Luo Y, Wu P, Zhang G, Zeng Q, Wang L, Yang Z, Xue L, Zheng B, et al: m6A regulator expression profile predicts the prognosis, benefit of adjuvant chemotherapy, and response to anti-PD-1 immunotherapy in patients with small-cell lung cancer. BMC Med. 19:2842021. View Article : Google Scholar : PubMed/NCBI | |
|
Schmittgen TD and Livak KJ: Analyzing real-time PCR data by the comparative C(T) method. Nat Protoc. 3:1101–1108. 2008. View Article : Google Scholar : PubMed/NCBI | |
|
Xu X, Mao Y, Feng Z, Dai F, Gu T and Zheng J: SENP1 inhibits ferroptosis and promotes head and neck squamous cell carcinoma by regulating ACSL4 protein stability via SUMO1. Oncol Rep. 51:342024. View Article : Google Scholar : PubMed/NCBI | |
|
Meyer KD, Saletore Y, Zumbo P, Elemento O, Mason CE and Jaffrey SR: Comprehensive analysis of mRNA methylation reveals enrichment in 3′ UTRs and near stop codons. Cell. 149:1635–1646. 2012. View Article : Google Scholar : PubMed/NCBI | |
|
Dominissini D, Moshitch-Moshkovitz S, Schwartz S, Salmon-Divon M, Ungar L, Osenberg S, Cesarkas K, Jacob-Hirsch J, Amariglio N, Kupiec M, et al: Topology of the human and mouse m6A RNA methylomes revealed by m6A-seq. Nature. 485:201–206. 2012. View Article : Google Scholar : PubMed/NCBI | |
|
Jiang X, Liu B, Nie Z, Duan L, Xiong Q, Jin Z, Yang C and Chen Y: The role of m6A modification in the biological functions and diseases. Signal Transduct Target Ther. 6:742021. View Article : Google Scholar : PubMed/NCBI | |
|
Niu Y, Zhao X, Wu YS, Li MM, Wang XJ and Yang YG: N6-methyl-adenosine (m6A) in RNA: An old modification with a novel epigenetic function. Genomics Proteomics Bioinformatics. 11:8–17. 2013. View Article : Google Scholar : PubMed/NCBI | |
|
Han J, Kong H, Wang X and Zhang XA: Novel insights into the interaction between N6-methyladenosine methylation and noncoding RNAs in musculoskeletal disorders. Cell Prolif. 55:e132942022. View Article : Google Scholar : PubMed/NCBI | |
|
Chen M, Wei L, Law CT, Tsang FHC, Shen J, Cheng CLH, Tsang LH, Ho DWH, Chiu DKC, Lee JMF, et al: RNA N6-methyladenosine methyltransferase-like 3 promotes liver cancer progression through YTHDF2-dependent posttranscriptional silencing of SOCS2. Hepatology. 67:2254–2270. 2018. View Article : Google Scholar : PubMed/NCBI | |
|
Dai YZ, Liu YD, Li J, Chen MT, Huang M, Wang F, Yang QS, Yuan JH and Sun SH: METTL16 promotes hepatocellular carcinoma progression through downregulating RAB11B-AS1 in an m6A-dependent manner. Cell Mol Biol Lett. 27:412022. View Article : Google Scholar : PubMed/NCBI | |
|
You Y, Wen D, Zeng L, Lu J, Xiao X, Chen Y, Song H and Liu Z: ALKBH5/MAP3K8 axis regulates PD-L1+ macrophage infiltration and promotes hepatocellular carcinoma progression. Int J Biol Sci. 18:5001–5018. 2022. View Article : Google Scholar : PubMed/NCBI | |
|
Li Q, Ni Y, Zhang L, Jiang R, Xu J, Yang H, Hu Y, Qiu J, Pu L, Tang J and Wang X: HIF-1α-induced expression of m6A reader YTHDF1 drives hypoxia-induced autophagy and malignancy of hepatocellular carcinoma by promoting ATG2A and ATG14 translation. Signal Transduct Target Ther. 6:762021. View Article : Google Scholar : PubMed/NCBI | |
|
Zhang C, Huang S, Zhuang H, Ruan S, Zhou Z, Huang K, Ji F, Ma Z, Hou B and He X: YTHDF2 promotes the liver cancer stem cell phenotype and cancer metastasis by regulating OCT4 expression via m6A RNA methylation. Oncogene. 39:4507–4518. 2020. View Article : Google Scholar : PubMed/NCBI | |
|
Zhou R, Ni W, Qin C, Zhou Y, Li Y, Huo J, Bian L, Zhou A and Li J: A functional loop between YTH domain family protein YTHDF3 mediated m6A modification and phosphofructokinase PFKL in glycolysis of hepatocellular carcinoma. J Exp Clin Cancer Res. 41:3342022. View Article : Google Scholar : PubMed/NCBI | |
|
Luo J, Zheng J, Hao W, Zeng H, Zhang Z and Shao G: lncRNA PCAT6 facilitates cell proliferation and invasion via regulating the miR-326/hnRNPA2B1 axis in liver cancer. Oncol Lett. 21:4712021. View Article : Google Scholar : PubMed/NCBI | |
|
Yang Y, Wu J, Liu F, He J, Wu F, Chen J and Jiang Z: IGF2BP1 promotes the liver cancer stem cell phenotype by regulating MGAT5 mRNA stability by m6A RNA methylation. Stem Cells Dev. 30:1115–1125. 2021.PubMed/NCBI | |
|
Pu J, Wang J, Qin Z, Wang A, Zhang Y, Wu X, Wu Y, Li W, Xu Z, Lu Y, et al: IGF2BP2 promotes liver cancer growth through an m6A-FEN1-dependent mechanism. Front Oncol. 10:5788162020. View Article : Google Scholar : PubMed/NCBI | |
|
Yu H and Zhang Z: ALKBH5-mediated m6A demethylation of lncRNA RMRP plays an oncogenic role in lung adenocarcinoma. Mamm Genome. 32:195–203. 2021. View Article : Google Scholar : PubMed/NCBI | |
|
Guo T, Liu DF, Peng SH and Xu AM: ALKBH5 promotes colon cancer progression by decreasing methylation of the lncRNA NEAT1. Am J Transl Res. 12:4542–4549. 2020.PubMed/NCBI | |
|
Qian X, Yang J, Qiu Q, Li X, Jiang C, Li J, Dong L, Ying K, Lu B, Chen E, et al: LCAT3, a novel m6A-regulated long non-coding RNA, plays an oncogenic role in lung cancer via binding with FUBP1 to activate c-MYC. J Hematol Oncol. 14:1122021. View Article : Google Scholar : PubMed/NCBI | |
|
Chen X, Zhang L, Geng J, Chen Z and Cui X: MiR-205-5p functions as a tumor suppressor in gastric cancer cells through downregulating FAM84B. J Oncol. 2022:82678912022.PubMed/NCBI | |
|
Gulei D, Magdo L, Jurj A, Raduly L, Cojocneanu-Petric R, Moldovan A, Moldovan C, Florea A, Pasca S, Pop LA, et al: The silent healer: miR-205-5p up-regulation inhibits epithelial to mesenchymal transition in colon cancer cells by indirectly up-regulating E-cadherin expression. Cell Death Dis. 9:662018. View Article : Google Scholar : PubMed/NCBI | |
|
Kan J, Fu B, Zhou R, Zhou D, Huang Y, Zhao H, Zhang Y, Rong Y, Dong J, Xia L, et al: He-Chan Pian inhibits the metastasis of non-small cell lung cancer via the miR-205-5p-mediated regulation of the GREM1/Rap1 signaling pathway. Phytomedicine. 94:1538212022. View Article : Google Scholar : PubMed/NCBI | |
|
Toro AU, Shukla SK and Bansal P: Micronome revealed miR-205-5p as key regulator of VEGFA during cancer related angiogenesis in hepatocellular carcinoma. Mol Biotechnol. 65:1178–1186. 2023. View Article : Google Scholar : PubMed/NCBI | |
|
Liu X, Chen D, Chen H, Wang W, Liu Y, Wang Y, Duan C, Ning Z, Guo X, Otkur W, et al: YB1 regulates miR-205/200b-ZEB1 axis by inhibiting microRNA maturation in hepatocellular carcinoma. Cancer Commun (Lond). 41:576–595. 2021. View Article : Google Scholar : PubMed/NCBI | |
|
Yi L, He S, Cheng Z, Chen X, Ren X and Bai Y: DNAJA1 stabilizes EF1A1 to promote cell proliferation and metastasis of liver cancer mediated by miR-205-5p. J Oncol. 2022:22924812022. View Article : Google Scholar : PubMed/NCBI | |
|
Shao P, Qu WK, Wang CY, Tian Y, Ye ML, Sun DG, Sui JD, Wang LM, Fan R and Gao ZM: MicroRNA-205-5p regulates the chemotherapeutic resistance of hepatocellular carcinoma cells by targeting PTEN/JNK/ANXA3 pathway. Am J Transl Res. 9:4300–4307. 2017.PubMed/NCBI | |
|
Denisenko ON, O'Neill B, Ostrowski J, Van Seuningen I and Bomsztyk K: Zik1, a transcriptional repressor that interacts with the heterogeneous nuclear ribonucleoprotein particle K protein. J Biol Chem. 271:27701–27706. 1996. View Article : Google Scholar : PubMed/NCBI | |
|
Ota T, Suzuki Y, Nishikawa T, Otsuki T, Sugiyama T, Irie R, Wakamatsu A, Hayashi K, Sato H, Nagai K, et al: Complete sequencing and characterization of 21,243 full-length human cDNAs. Nat Genet. 36:40–45. 2004. View Article : Google Scholar : PubMed/NCBI | |
|
Liu Y, Yang Z, Du F, Yang Q, Hou J, Yan X, Geng Y, Zhao Y and Wang H: Molecular mechanisms of pathogenesis in hepatocellular carcinoma revealed by RNA-sequencing. Mol Med Rep. 16:6674–6682. 2017. View Article : Google Scholar : PubMed/NCBI | |
|
Liu P, Jiang W, Zhao J and Zhang H: Integrated analysis of genome-wide gene expression and DNA methylation microarray of diffuse large B-cell lymphoma with TET mutations. Mol Med Rep. 16:3777–3782. 2017. View Article : Google Scholar : PubMed/NCBI | |
|
Oka D, Yamashita S, Tomioka T, Nakanishi Y, Kato H, Kaminishi M and Ushijima T: The presence of aberrant DNA methylation in noncancerous esophageal mucosae in association with smoking history: A target for risk diagnosis and prevention of esophageal cancers. Cancer. 115:3412–3426. 2009. View Article : Google Scholar : PubMed/NCBI | |
|
Mihara M, Yoshida Y, Tsukamoto T, Inada KI, Nakanishi Y, Yagi Y, Imai K, Sugimura T, Tatematsu M and Ushijima T: Methylation of multiple genes in gastric glands with intestinal metaplasia: A disorder with polyclonal origins. Am J Pathol. 169:1643–1651. 2006. View Article : Google Scholar : PubMed/NCBI | |
|
Ni JS, Zheng H, Huang ZP, Hong YG, Ou YL, Tao YP, Wang MC, Wang ZG, Yang Y and Zhou WP: MicroRNA-197-3p acts as a prognostic marker and inhibits cell invasion in hepatocellular carcinoma. Oncol Lett. 17:2317–2327. 2019.PubMed/NCBI | |
|
Deng X, Su R, Weng H, Huang H, Li Z and Chen J: RNA N(6)-methyladenosine modification in cancers: Current status and perspectives. Cell Res. 28:507–517. 2018. View Article : Google Scholar : PubMed/NCBI | |
|
Ma JZ, Yang F, Zhou CC, Liu F, Yuan JH, Wang F, Wang TT, Xu QG, Zhou WP and Sun SH: METTL14 suppresses the metastatic potential of hepatocellular carcinoma by modulating N6-methyladenosine-dependent primary MicroRNA processing. Hepatology. 65:529–543. 2017. View Article : Google Scholar : PubMed/NCBI | |
|
Lin S, Choe J, Du P, Triboulet R and Gregory RI: The m(6)A methyltransferase METTL3 promotes translation in human cancer cells. Mol Cell. 62:335–345. 2016. View Article : Google Scholar : PubMed/NCBI |