


Lysine methyltransferase 5C increases the proliferation and metastatic abilities of clear cell renal cell carcinoma via aerobic glycolysis
- Authors:
- Published online on: March 1, 2024 https://doi.org/10.3892/ijo.2024.5633
- Article Number: 45
-
Copyright: © Zeng et al. This is an open access article distributed under the terms of Creative Commons Attribution License.
Abstract
Introduction
Kidney cancer affects >430,000 individuals worldwide, accounting for ~2.2% of all cancer cases (1). The incidence of kidney cancer continues to increase in both men and women (2), and predictions have indicated that the incidence and mortality of kidney cancer will be >79,000 and almost 13,920 individuals, respectively, in the United States in 2022 (3). The majority of kidney cancer cases are renal cell carcinoma (RCC), accounting for 90% of all renal malignancies (4), and the most prevalent (75-80%) histological RCC subtype is clear cell RCC (ccRCC) (5). Although ccRCC can be successfully treated with surgical or ablative strategies if diagnosed early, up to a third of patients will present with or develop metastases (6), which is often lethal. Therefore, novel effective biomarkers and treatment strategies should be explored further.
In eukaryotic cells, the functional unit of chromatin is the nucleosome, which is composed of an octamer of four histones (typically H3, H4, H2A and H2B), around which 147 base pairs of DNA are wrapped (7). The core of the nucleosome is formed by the globular regions of histones, while the N-terminal tails protrude from the nucleosomes, several residues of which can be enriched with a variety of posttranslational modifications (PTMs) such as acetylation, methylation and phosphorylation (8). Dysregulation of these modifications can shift the balance of gene expression and is therefore frequently observed in human cancer (9-12). Histone methylation is a crucial PTM and typically occurs on the lysine residues in the tails of histones H3 and H4 (13,14). K20 is the only lysine residue on the histone H4 tail that can be methylated and methylation of H4K20 [mono-(me1), di-(me2) and tri-methylation (me3)] plays a critical role in a range of biological processes including gene expression, cell cycle progression, transcriptional regulation and genomic integrity (15,16).
Histone methyltransferases specifically catalyze the methylation of K20 of histone H4 to regulate transcription. Lysine methyltransferase 5B and lysine methyltransferase 5C (KMT5C; also known as SUV420H2) are responsible for H4K20me2 and H4K20me3 of histone H4, respectively (17), and require the H4K20me1 substrate that is generated by PR-SET7 (also known as KMT5A). H4K20me3 is primarily located in pericentric heterochromatin, telomeres, imprinted regions and repetitive elements, which indicates its roles in cell differentiation, chromatin assembly, DNA replication and cell cycle control (18-20).
It has been shown that KMT5C can stabilize genome integrity such as in DNA damage repair, DNA replication and chromatin compaction processes (21). KMT5C was found to be involved in telomerase expression in chronic lymphocytic leukemia and remains an important predictor of survival outcomes (19). Expression of KMT5C in MDA-MB-231 human breast cancer cells suppresses the expression of cancer-related genes such as the Src substrate, Tensin-3, a focal adhesion protein that contributes to cancer cell migration. Conversely, loss of H4K20me3 in breast cancer promotes the expression of cancer-promoting genes and is related to tumor progression (22). In addition, in breast cancer, microRNA (miR)-29a targets KMT5C to promote cell migration and invasion. Upregulation of miR-29a attenuates the repression of connective tissue growth factor (CTGF) and growth response protein-1 (EGR1) via downregulation of H4K20me3. Furthermore, knockdown of KMT5C expression promotes migration and invasion of breast cancer in vitro and in vivo (23). Conversely, KMT5C promotes epithelial-mesenchymal transition (EMT) in pancreatic cancer (24), and its knockdown results in the downregulation of several key drivers of the epithelial state and correlates with the loss of an epithelial state. In addition, overexpression of KMT5C using overexpression plasmids increases the migratory potential and drug resistance in pancreatic cancer (25).
Due to the lack of previous research, the present study aimed to determine whether KMT5C plays significant roles in the progression of ccRCC and the underlying mechanisms of such roles. The knockdown of KMT5C in ccRCC cell lines was conducted and multiple aspects such as cell proliferation, cell cycle alteration, cell migration and invasion were examined. In addition, data from a public database and obtained clinical samples were combined to determine the clinical significance of KMT5C in ccRCC.
Materials and methods
Cell culture
In the present study, three human ccRCC cell lines (786O, A498 and Caki-1), 293T cells and a human proximal tubular epithelial cell line, HK2, were obtained from the American Type Culture Collection. The human ccRCC cell line, OSRC2, was purchased from The Cell Bank of Type Culture Collection of The Chinese Academy of Sciences. The cell lines were genetically confirmed by short tandem repeat analysis and routinely tested for mycoplasma contamination. 786O and OSRC2 cells were cultured in RPMI-1640 medium (HyClone; Cytiva), 293T and A498 cells were cultured in Dulbecco's Modified Eagle's Medium (DMEM; HyClone; Cytiva), Caki-1 cells were cultured in McCoy's 5A (modified) medium (Gibco; Thermo Fisher Scientific, Inc.) and HK2 cells were cultured in DMEM/F12 medium (Gibco; Thermo Fisher Scientific, Inc.). All media were supplemented with 10% fetal bovine serum (FBS; Gibco; Thermo Fisher Scientific, Inc.) and 1% penicillin-streptomycin solution. Cells were maintained in an incubator with 5% CO2 at 37°C.
RNA interference
For KMT5C knockdown, three short hairpin (sh)RNA oligonucleotides targeting three different exons (#1, 5′-CGA CAG AGT GAC AGC ACG A-3′; #2, 5′-GCG GTG AAG AGC TGT GAC A-3′; #3, 5′-GTGAAGGTGCTCCGGGACA-3′) of the KMT5C gene and a scrambled shRNA [used as the negative control (shControl, 5′-TTC TCC GAA CGT GTC ACG T-3′)] were cloned into the pMKO vector (cat. no. 8452; Addgene, Inc.) between the EcoRI and Agel restriction sites. 293T cells were transfected with the KMT5C shRNAs using the 3rd generation lentiviral transfection system with Lipofectamine 2000 (Invitrogen; Thermo Fisher Scientific, Inc.) in accordance with the manufacturer's protocol. A total of 8 μg of lentiviral plasmid was used for transfection and the ratio of the lentiviral plasmid (pMKO): packaging vector (GAG): envelope (VSVG) was 4:3:1. The supernatant containing the virus was subsequently collected and used to infect A498 and OSRC2 cells in the presence of 8 μg/ml polybrene (cat. no. HY-112735; MedChemExpress). The multiplicity of infection (MOI) was determined by a series of concentration gradient pre-experiments. The MOI of A498 and OSRC2 cells were 50 and 30, respectively. The cells were co-incubated with lentivirus for 12 h, when the medium was refreshed. Stable cell lines were selected using 5 μg/ml puromycin (cat. no. HY-B1743A; MedChemExpress) and maintain in medium containing 1 μg/ml puromycin. The selection procedure lasted until all untransfected cells in the control group were killed by puromycin, which was typically 48 h. The selected cells were then used for further experimental analyses. The time interval between transduction and subsequent experimentation was >72 h.
Patient tissue samples
Tissue samples were obtained from 207 naïve patients with ccRCC who underwent partial or radical nephrectomy between March, 2005 and December, 2009 at Fudan University Shanghai Cancer Center (FUSCC; Shanghai, China). The inclusion criteria for the selection of patients with ccRCC were as follows: i) Cytologically or histologically confirmed ccRCC; ii) patients who underwent partial or radical nephrectomy; and iii) patients aged ≥18 years old. The exclusion criteria for the selection of patients with ccRCC were as follows: i) Prior treatment with chemotherapy, hormonal therapy, immunotherapy, an experimental agent and/or radiation therapy; ii) history of a non-RCC malignancy; and iii) pregnant women. Tumorous and paired adjacent non-tumorous tissues from the 207 selected patients (aged 20 to 83 years old; 140 males and 67 females) were included in the immunohistochemistry (IHC) analysis. The samples were formalin-fixed and paraffin-embedded tissues. Among these samples, 12 fresh pairs of tissues were analyzed by western blotting. Written informed consent was obtained from each patient for the collection of their clinical information and tissues for scientific research. The study was performed in accordance with the ethical standards of the Declaration of Helsinki and was approved by the Institution Review Board of Fudan University Shanghai Cancer Center (approval no. 2304-ZZK-89).
Sample collection from The Cancer Genome Atlas (TCGA) and data processing
The transcriptional data and clinical information of patients with ccRCC [referred to as Kidney Renal Clear Cell Carcinoma (KIRC) in TCGA] was obtained from TCGA using UCSC Xena (http://xena.ucsc.edu/) (11,26). A pan-cancer analysis was conducted based on the transcriptional data and clinical information of all types of cancer in TCGA. The survival (rdocumentation.org/packages/survival) package was used to conduct the survival analysis. ggplot2 (https://github.com/tidyverse/ggplot2) and heatmap (rdocumentation.org/packages/stats/versions/3.6.2/topics/heatmap) in R software (version 4.1.3; https://www.r-project.org/) were used to process and visualize the bioinformatic results. R-studio (version, 2023.09.1+494; http://www.rstudio.com/) was used as an integrated development environment for R software.
Western blotting
Cultured cells were lysed 24 h after transfection using BC100 buffer (20 mM Tris-HCl pH 7.3, 0.2 mM EDTA, 100 mM NaCl, 20% glycerol, 0.2% Triton X-100 and protease inhibitor). Tissues were pulverized and homogenized in RIPA buffer (cat. no. R0278; Sigma-Aldrich; Merck KGaA) with protease inhibitor cocktail (cat. no. R8340; Sigma-Aldrich; Merck KGaA) on ice for 30 min. The supernatant containing total proteins was collected after centrifugation at 12,000 × g for 15 min at 4°C. Total protein was subsequently quantified using a BCA Protein Assay kit (cat. no. P0011; Beyotime Institute of Biotechnology). The samples were then mixed with SDS loading buffer and heated at 95°C for 10 min. A total of 30 μg total protein was loaded per lane of a 10% gel for SDS-PAGE, after which protein was transferred to nitrocellulose membranes (Cytiva). The membranes were blocked in Tris-buffered saline (TBS; pH 7.4) containing 5% non-fat milk and 0.1% Tween-20 overnight at 4°C, washed three times in TBS containing 0.1% Tween-20, followed by incubation with primary antibodies overnight at 4°C. Subsequently, the membranes were incubated with the relevant secondary antibodies for 1 h at room temperature. Antibody binding was visualized using the ECL Chemiluminescence System (cat. no. 36208ES60; Shanghai Yeasen Biotechnology Co., Ltd.). The primary antibodies used were anti-KMT5C (1:1,000; cat. no. A16235; ABclonal Biotech Co., Ltd.), anti-E-cadherin (1:1,000; cat. no. 14472; Cell Signaling Technology, Inc.), anti-N-cadherin (1:1,000; cat. no.66219-1-Ig; ProteinTech Group, Inc.), anti-Snail (1:1,000; cat. no. 3879; Cell Signaling Technology, Inc.), anti-Twist1 (1:500; cat. no. GTX50821; GeneTex, Inc.), anti-Twist2 (1:500; cat. no. GTX50850; GeneTex, Inc.) and anti-β-actin (1:2,000; cat. no. AC004; ABclonal Biotech Co., Ltd.). The secondary antibodies used were goat anti-rabbit IgG-HRP (1:5,000; cat. no. SA00001-2; ProteinTech Group, Inc.) and goat anti-mouse IgG-HRP (1:5,000; cat. no. SA00001-1; ProteinTech Group, Inc.). All the samples were normalized to β-actin using ImageJ (version 1.53h; https://imagej.net/ij/).
IHC
Specimens were fixed with 10% formalin for 24 h at 4°C, followed by dehydration, embedding in paraffin blocks and cutting into 4-μm sections. The slides were heated at 65°C for 1 h, then transferred to 100% xylol for 10 min, 100% xylol for 10 min, 100% ethanol for 5 min, 90% ethanol for 5 min, 70% ethanol for 5 min and PBS for 5-10 min in succession. Subsequently, certain sections were deparaffinized and stained with hematoxylin for 2 min and eosin for 3 min at room temperature for morphological examination. The other slides were immersed in 10 mM citrate buffer (pH 6.0), boiled for 10 min in a steam pot and then retained in the steam pot for 15 min to cool down. After dewaxing and immersing in 3% H2O2 to quench the endogenous peroxidase activity, slides were immunostained with anti-KMT5C antibody (1:200; cat. no. ab267359; Abcam) at 4°C overnight. After washing three times with phosphate-buffered saline (PBS; Sperikon Life Science & Biotechnology Co., Ltd.; Sichuan Nuohong Huikang Biotechnology Co., Ltd), the biotinylated secondary antibody from GTVision™ III Detection System/Mo&Rb (including DAB) (provided at working concentration; cat. no. GK500710; GeneTech) was incubated with the tissues at 37°C for 1 h. Bound KMT5C proteins were then visualized by staining with 3,3′-diaminobenzidine tetrahydrochloride (cat. no. GK500710; GeneTech). Finally, two pathologists independently assessed all tissue slides in terms of KMT5C protein staining intensity and the percentage of positive cells. The intensity of KMT5C staining was scored as follows: 0, no signal; 1, weak; 2, moderate; and 3, strong. The percentage of positive cells was scored as follows: 1, 0-30%; 2, 31-60%; and 3, 60-100%. The product of the intensity score and percentage score was used as the total score, in which >3 indicated high KMT5C expression. A light Olympus IX73 inverted microscope was used to observe the slides and ImageJ was used to analyze the results.
Reverse transcription-quantitative PCR (RT-qPCR)
Total RNA was extracted from cultured cells using TRIzol® reagent (cat. no. 15596026; Invitrogen; Thermo Fisher Scientific, Inc.) and was reverse transcribed using the High-Capacity cDNA Reverse Transcription kit (cat. no. 4368813; Thermo Fisher Scientific, Inc.), according to the manufacturer's instructions. qPCR was then performed using the cDNA and the SYBR Green PCR Master Mix kit (cat. no. A46113; Thermo Fisher Scientific, Inc.), according to the manufacturer's instructions. The thermocycling conditions consisted of an initial enzyme activation step for 2 min at 95°C, followed by 40 cycles of 15 sec at 95°C and 60 sec at 60°C. The dissociation step consisted of 15 sec at 95°C, 1 min at 60°C and 15 sec at 95°C. The experiments were performed in triplicate. β-actin mRNA was used as the internal control, and the relative amount of KMT5C mRNA normalized to β-actin was calculated using the 2−ΔΔCq method (27). All primers were obtained from Primerbank (https://pga.mgh.harvard.edu/primerbank/), the sequences of which are listed in Table I.
Cell proliferation assays
Cell proliferation assays were performed using Cell Counting Kit-8 (CCK-8; Dojindo Molecular Technologies, Inc.). Transfected ccRCC cells (A498 and OSRC2) were trypsinized with 0.25% trypsin solution (Sperikon Life Science & Biotechnology Co., Ltd.) and resuspended in medium and reseeded at a density of 2×10³ cells/well into a 96-well plate containing 100 μl medium. After the cells had adhered to the plate, cell proliferation was measured on days 1, 2, 3, 4 and 5 using CCK-8 according to the manufacturer's instructions. Briefly, 10 μl CCK-8 solution was added to each well and incubated at 37°C for 1.5 h, then the absorbance of each well was measured at 450 nm. All experiments were performed in triplicate.
Colony formation assays
A total of 300 A498 and OSRC2 cells/well were seeded into 6-well plates and cultured for 2 weeks. When colonies were visible, the cells were fixed with 4% paraformaldehyde for 20 min at room temperature and stained with bromophenol blue for 30 min at room temperature. The cells were subsequently washed with PBS until the colonies were visible. Images were obtained using a light Olympus IX73 microscope and the number and size of colonies in each well were counted manually. Colonies consisting of >50 cells were counted.
Synchronization of A498 and OSRC2 cells
A498 and OSRC2 cells were maintained in an incubator with 5% CO2 at 37°C. Cells were synchronized in G1/S phase via the double thymidine block method (28). Briefly, when cells reached a confluency of 25-30%, they were cultured with 2 mM thymidine medium for 24 h and washed twice with PBS, then fresh DMEM or RPMI-1640 medium supplemented with 10% FBS was added for 9 h. For the second block step, the cells were cultured with 2 mM thymidine medium for a further 24 h. Then cells were washed twice with PBS and fresh DMEM or RPMI-1640 medium supplemented with 10% FBS was added. Cells were harvested for flow cytometry analysis (see below) for whole cell cycle detection.
Flow cytometry analysis
A total of 1×10⁶ A498 and OSRC2 cells were cultured in a 6-well plate, washed with PBS, digested with 0.25% trypsin solution and resuspended in 0.5 ml PBS. The cells were then fixing with 4.5 ml pre-cooled 70% ethanol overnight at 4°C. The fixed cells were washed three times with PBS and incubated with 100 μl RNase A solution at 37°C for 30 min. Then, the cells were stained with a Cell Cycle Staining Kit [cat. no. 70-CCS012; MultiSciences (Lianke) Biotech Co., Ltd.] for 30 min in a dark room at room temperature. The DNA content was detected using a Beckman Coulter FC500 flow cytometer (Beckman Coulter, Inc.). The results were analyzed using ModFit LT (version 5.0; https://www.vsh.com/products/mflt/) and Flowjo (version 10.8; https://www.flowjo.com/) software.
Migration and invasion assays
Transwell inserts with 8-μm pores (Corning, Inc.) were placed in 24-well plates and used for migration and invasion assays. The Transwell inserts were coated with a thin Matrigel layer at a dilution ratio of 1:10 for the invasion assay at 37°C for 3 h. A total of 3×10⁴ A498 and OSRC2 cells in serum-free media were added to the upper chamber of the Transwell inserts and the lower chamber was filled with media supplemented with 10% FBS. The plates were incubated in an incubator with 5% CO2 at 37°C for 24 h, then the inserts were fixed with 4% paraformaldehyde for 20 min at room temperature. Subsequently, the inserts were washed with PBS and stained with 0.1% bromophenol blue for 30 min at room temperature. The cells that had not migrated or invaded were removed and the inserts were subsequently imaged using a light Olympus IX73 microscope. ImageJ was used to analyze the results.
Seahorse assay
The extracellular acidification rate (ECAR) and oxygen consumption rate (OCR) of A498 and OSRC2 cells were measured using the Seahorse Bioscience XF96 Extracellular Flux Analyzer and the Seahorse XF Glycolysis Stress Test and Cell Mito Stress Test kits (cat. no. 103010-100; Agilent Technologies, Inc.), according to the manufacturer's instructions. A498 and OSRC2 cells were seeded into XF96 Cell Culture Microplates (cat. no. 101085; Agilent Technologies, inc.) at a density of 1×10⁴ cells/well and allowed to adhere overnight at 37°C. Then, the culture medium was replaced with phenol red-free assay solution (cat. no. 103335-100; Agilent Technologies, Inc.) and the cells were equilibrated for 1 h without CO2, immediately before the extracellular flux (XF) assay. The glycolysis rate assay was performed in phenol red-free assay solution, and glucose, oligomycin and 2-deoxy-D-glucose were added at the times indicated by the manufacturer. For the mitochondrial stress test, oligomycin, carbonyl cyanide 4-(trifluoromethoxy) phenylhydrazone and antimycin A + rotenone, were added according to the manufacturer's instructions and protocols (29).
Statistical analysis
GraphPad Prism (version 8.0; Dotmatics.) was used for statistical analysis. Data are presented as the mean ± SD. Comparisons between two groups were performed using paired Student's t-test (tumor and adjacent normal tissue). A one-way ANOVA and Dunnett's multiple comparison test were used to compare the differences between more than two groups. Kaplan-Meier curves and the Log-rank test were implemented to assess the survival and prognostic value of KMT5C expression in ccRCC. P<0.05 was considered to indicate a statistically significant difference.
Results
KMT5C is an unfavorable prognostic factor for ccRCC
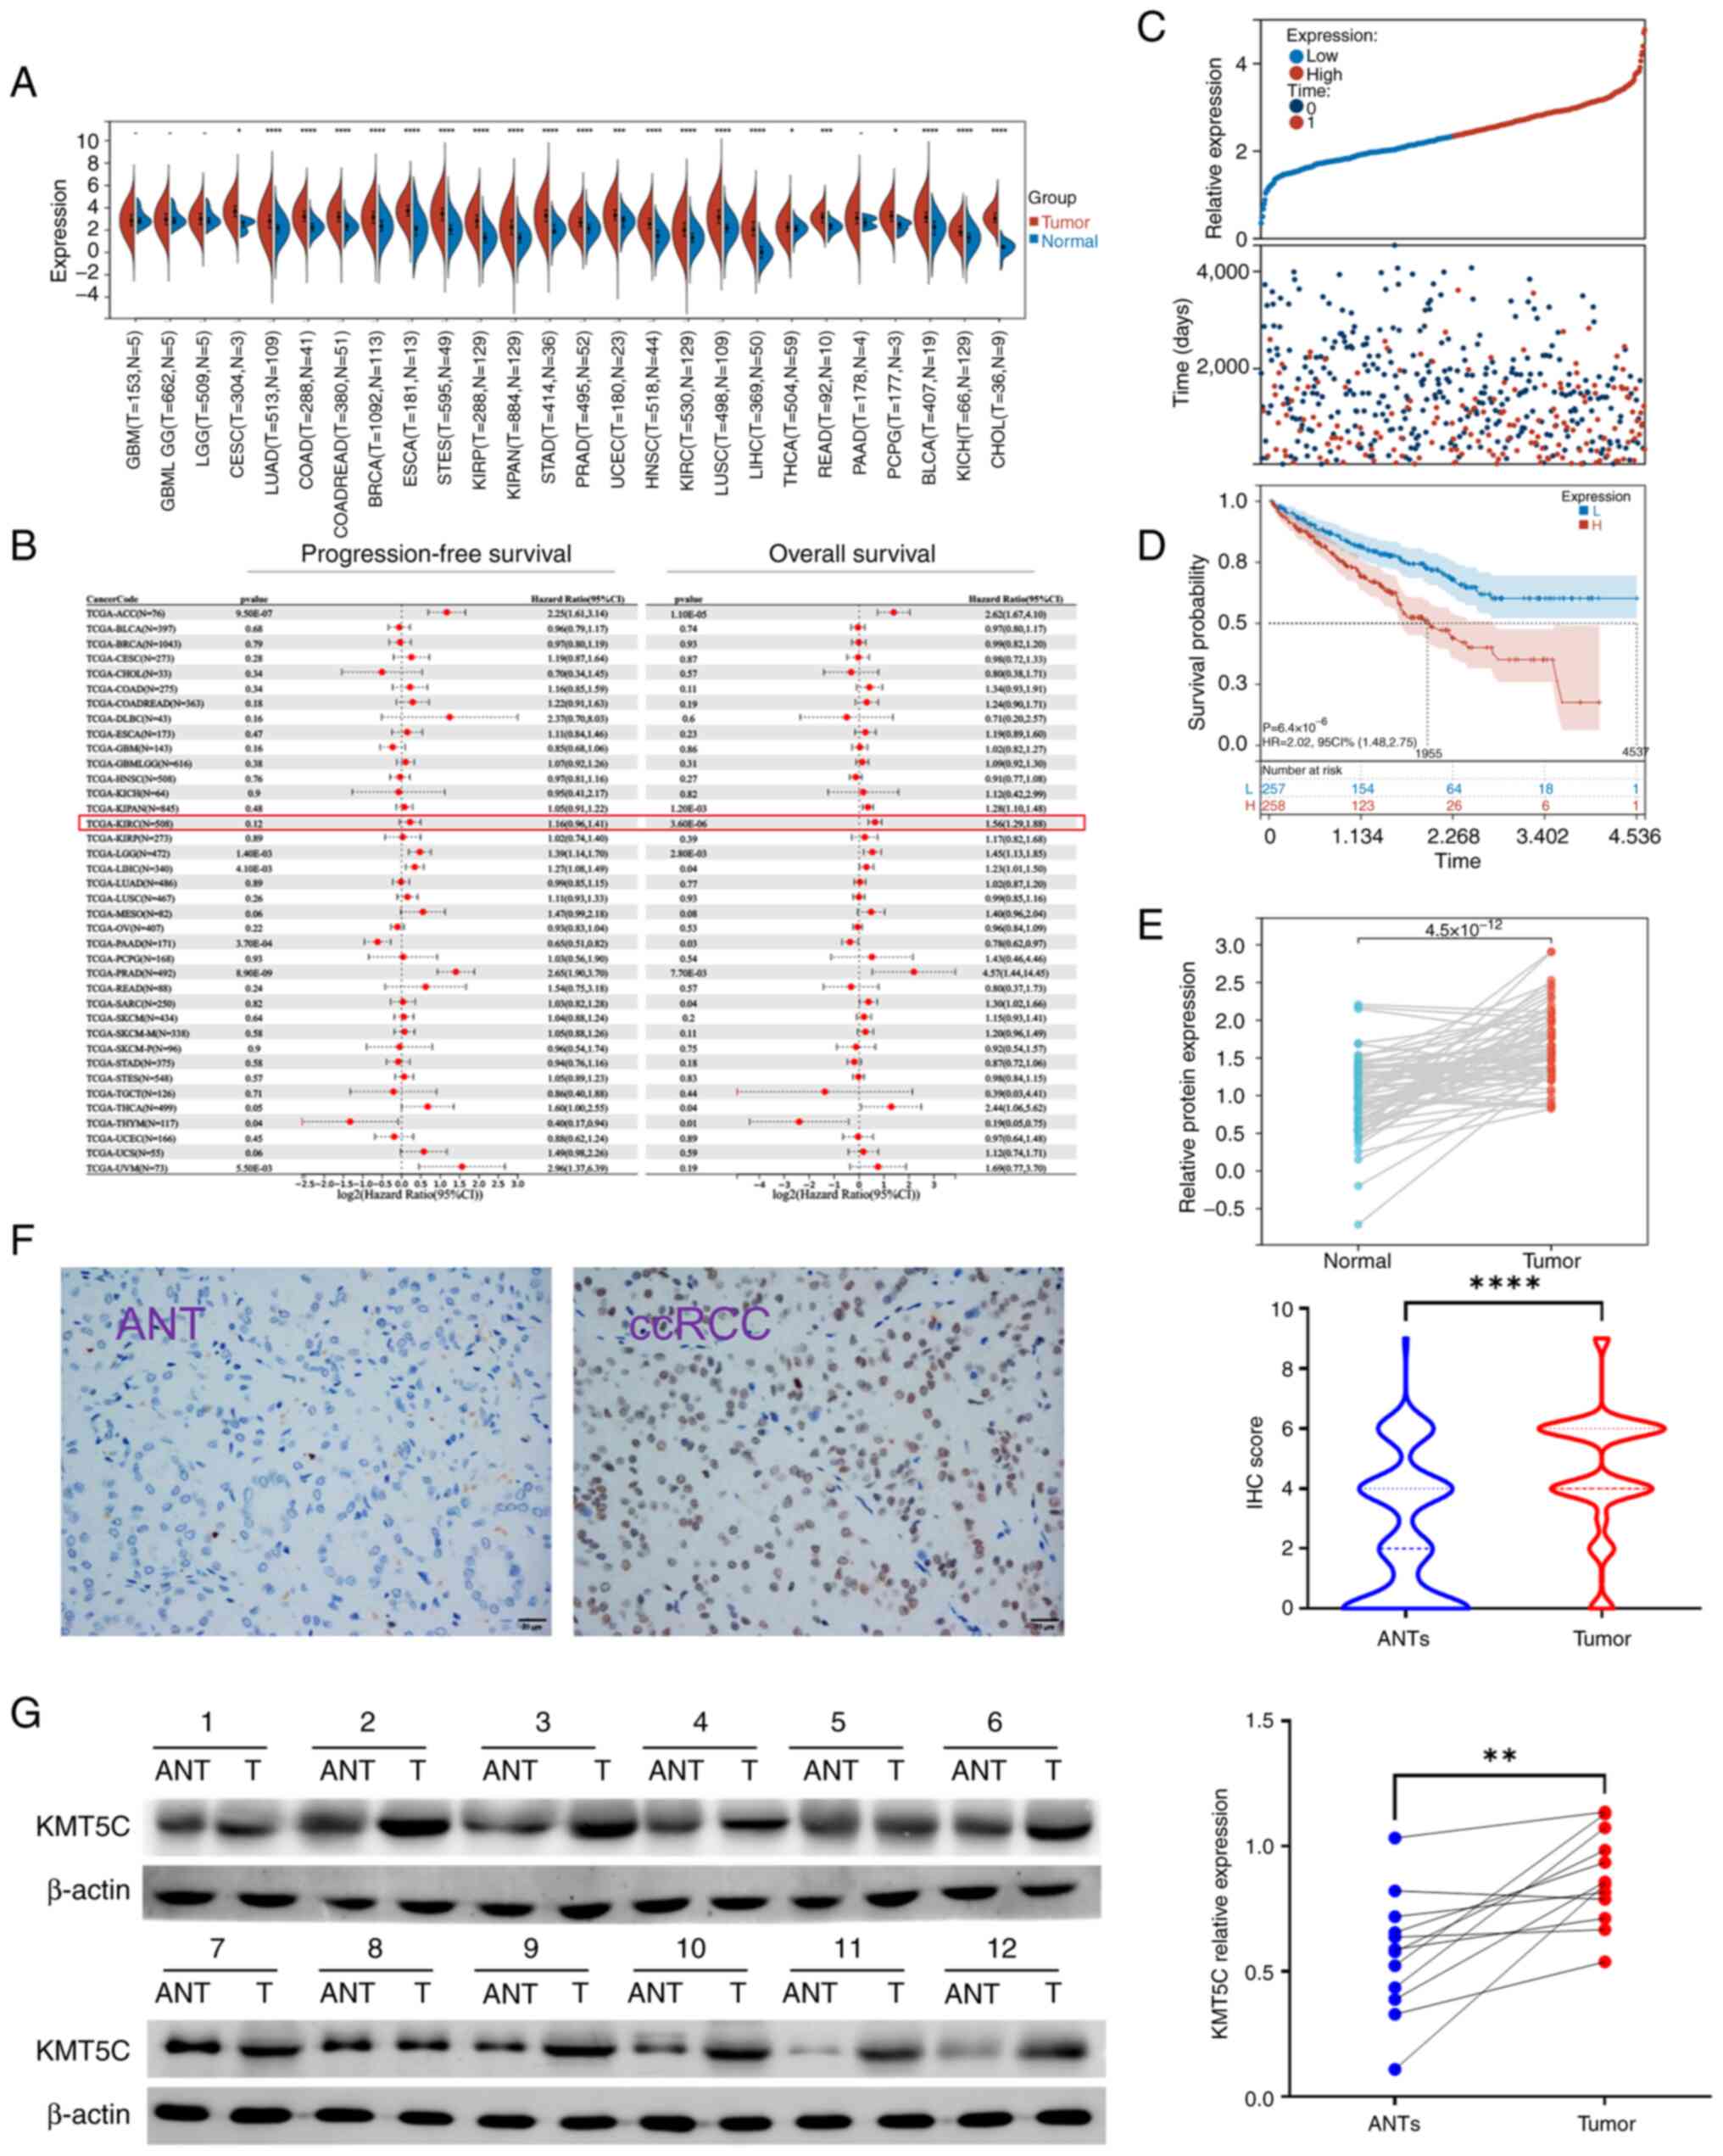
To investigate the expression and clinical significance of KMT5C in ccRCC, mRNA expression profiling was performed using TCGA database. The expression of KMT5C was significantly higher in tumor samples compared with normal samples in ccRCC (KIRC) (P<0.0001; Fig. 1A). Meanwhile, it was also observed that KMT5C was highly expressed in most other cancer types. Using the prognostic information obtained from TCGA, the overall survival rate (OS) and progression-free survival rate of patients with ccRCC were determined using Kaplan-Meier curves and the Log-rank test. It was found that high expression of KMT5C was associated with a shorter OS (hazard ratio, 1.56; 95% confidence interval, 1.29-1.88) in ccRCC (Fig. 1B). The OS of patients with ccRCC in TCGA with high or low KMT5C expression was further compared (Fig. 1C and D). High expression of KMT5C indicated a worse OS rate. Additionally, 72 pairs of transcriptional data from normal and cancerous ccRCC samples from TCGA were analyzed (Fig. 1E). The KMT5C expression levels in the ccRCC tissues were higher compared with the paired normal tissues. Adjacent non-tumorous and tumorous tissues were obtained from patients with ccRCC from FUSCC and stained for KMT5C using IHC (Fig. 1F). The KMT5C expression levels in the ccRCC tissues were higher compared with the paired adjacent non-tumorous tissues. Moreover, 12 pairs of adjacent non-tumorous and tumorous tissues obtained from patients with ccRCC from FUSCC were collected and KMT5C protein expression was analyzed using western blotting (Fig. 1G). Collectively, these results demonstrated that KMT5C expression levels were higher in the tumor tissues compared with the adjacent non-tumorous tissues, and that this high expression was indicative of an unfavorable prognosis.
KMT5C maintains aerobic glycolysis in ccRCC
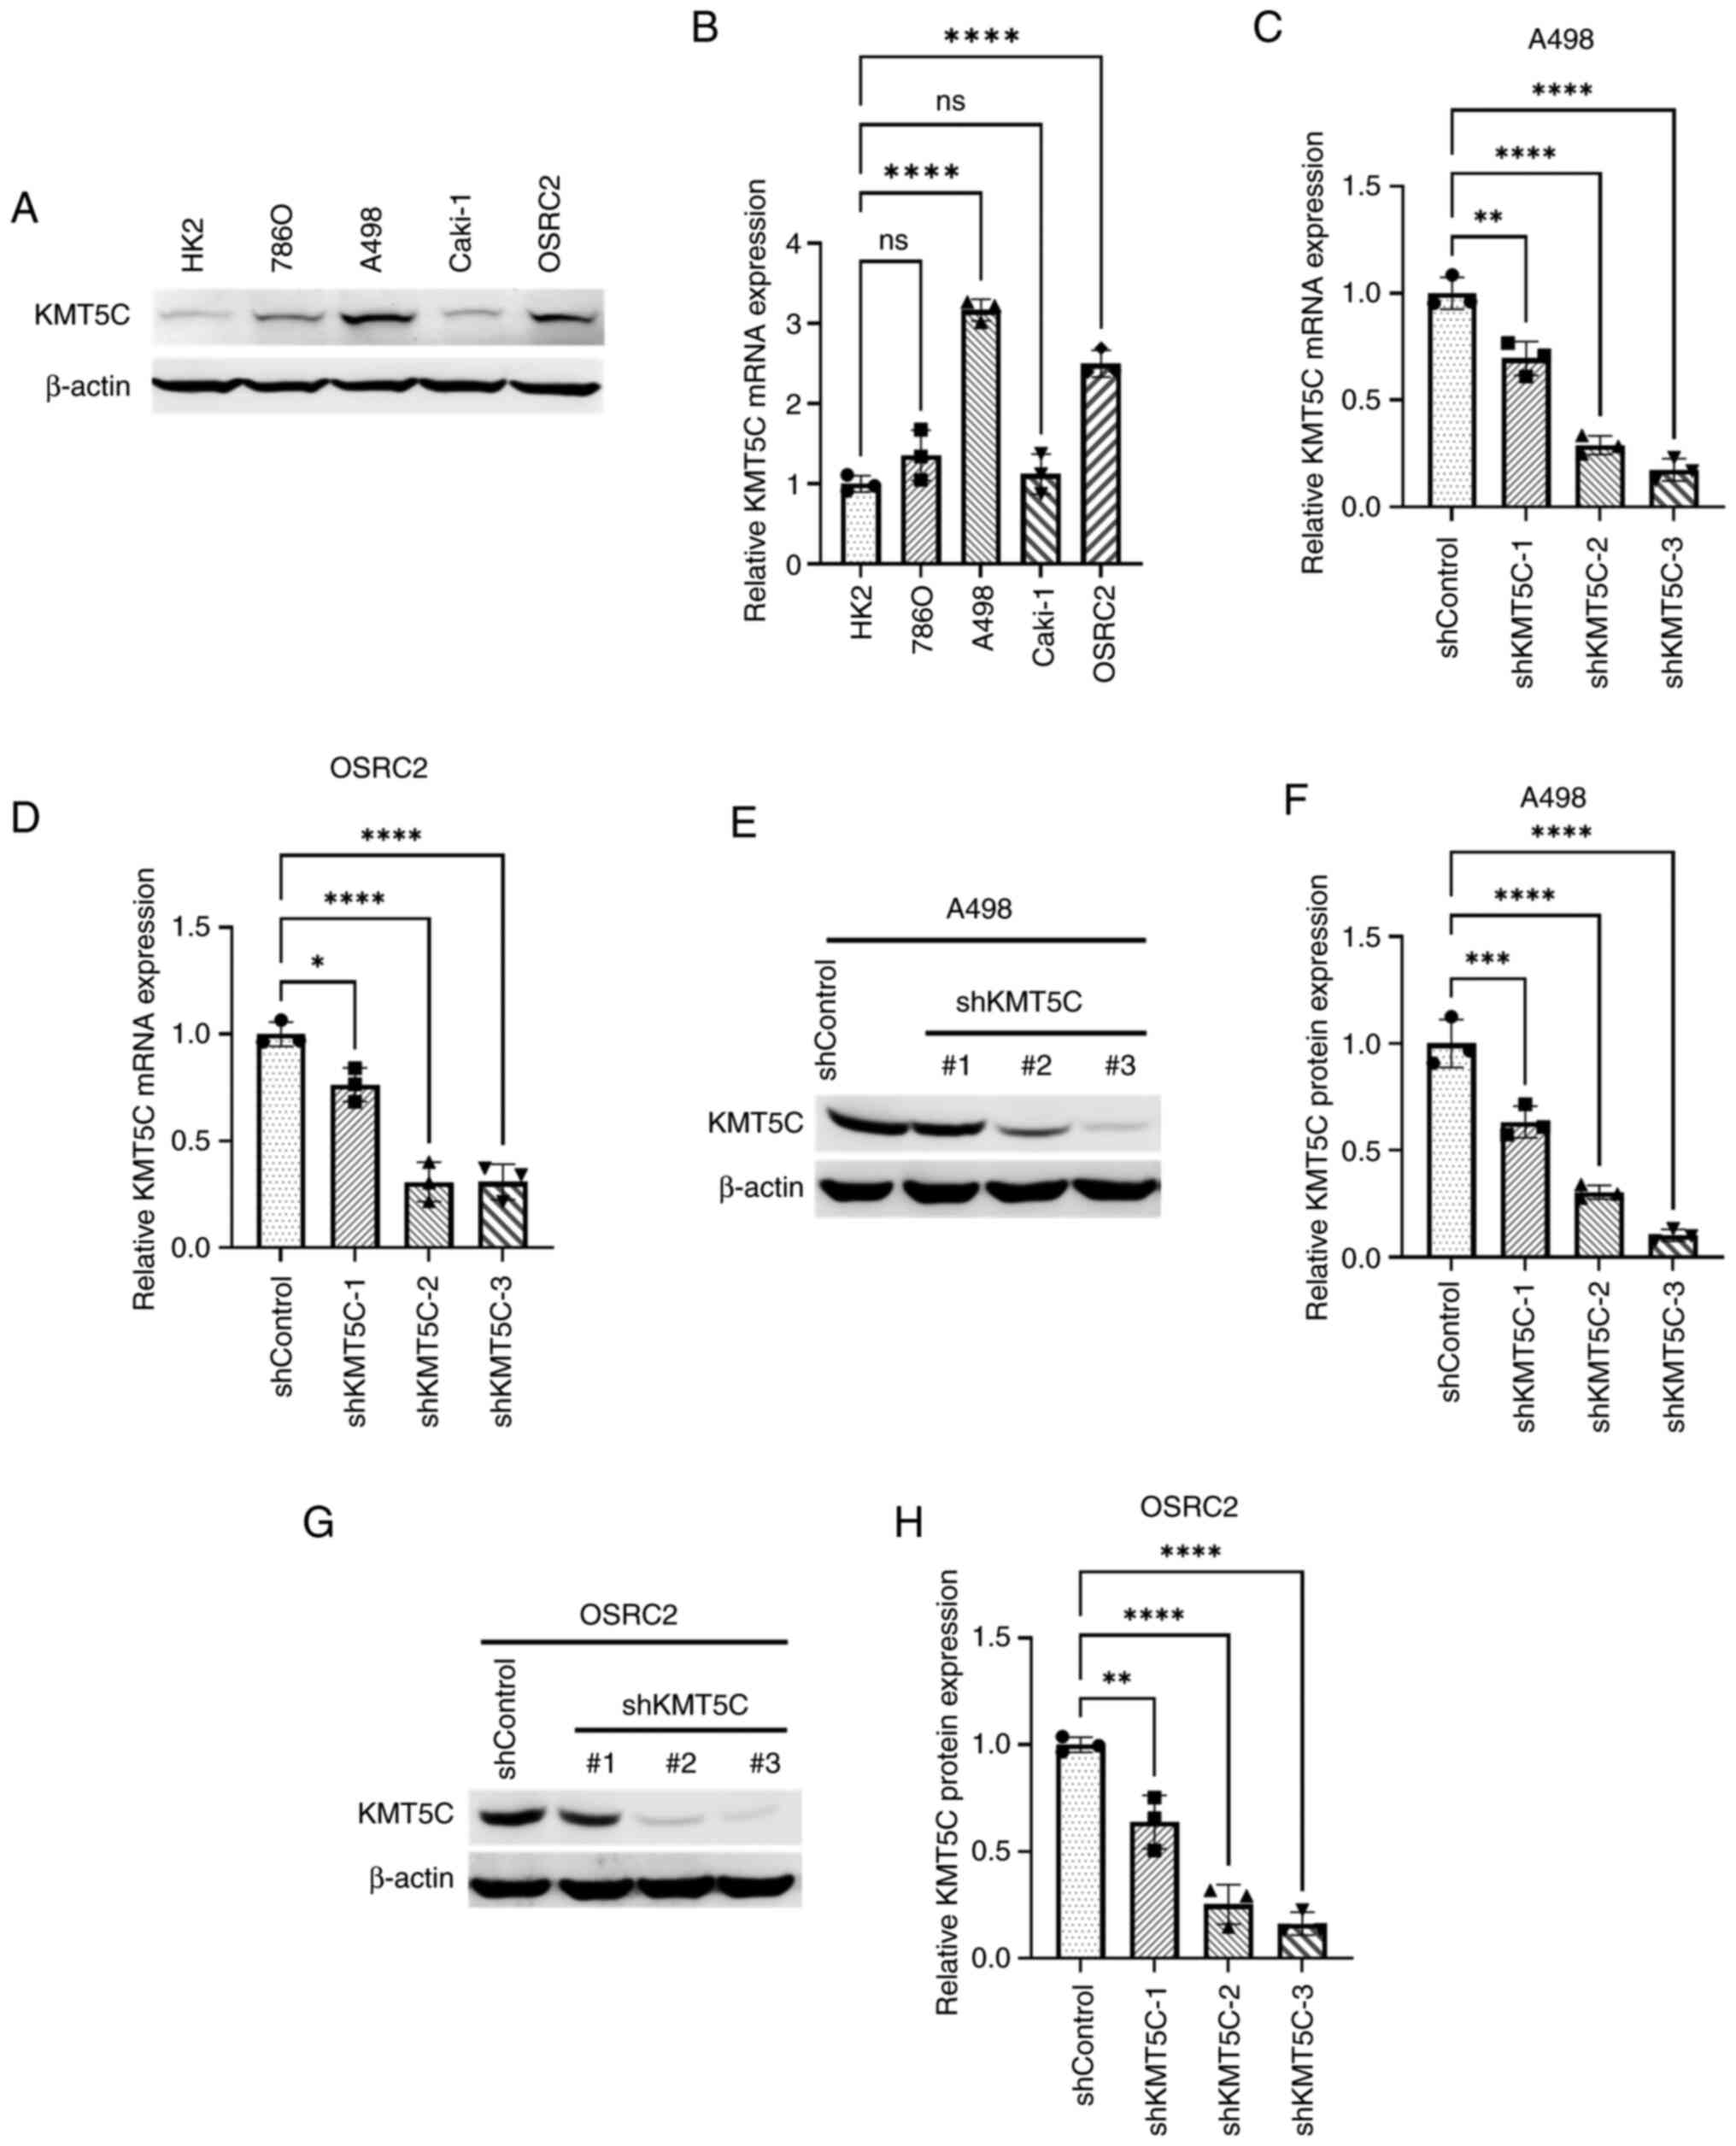
To study KMT5C in ccRCC, KMT5C expression levels were first determined in different ccRCC cell lines using western blotting and RT-qPCR (Fig. 2A and B). The protein and mRNA expression levels of KMT5C were notably higher in A498 and OSRC2 cells, and therefore, these two cell lines were used to stably knockdown KMT5C expression using plasmids containing shRNA. A total of three shRNA plasmids targeting three different exons of the KMT5C gene were used to knockdown KMT5C expression in A498 and OSRC2 cells. The knockdown of KMT5C was then examined at the mRNA and protein level. shKMT5C-2 and shKMT5C-3 plasmids resulted in a knockdown of KMT5C expression of up to 50% at the protein and mRNA level in A498 (Fig. 2E and F) and OSRC2 (Fig. 2G and H) cells. Cells stably expressing shKMT5C-2 and shKMT5C-3 were then used for further experiments.
Metabolic reprogramming is considered a hallmark of cancer and KMT5C has been found to be related to metabolic reprogramming (30,31). Thus, the role of KMT5C in the glycolysis of ccRCC cells was established in the present study. The ECAR was significantly decreased in KMT5C-knockdown cells compared with the control cells, indicating that KMT5C knockdown inhibited the glycolytic process in A498 (Fig. 3A and B) and OSRC2 (Fig. 3C and D) cells. Meanwhile, the OCR was measured to examine mitochondrial glucose oxidation. The maximal respiration of KMT5C-knockdown A498 (Fig. 3E and F) and OSRC2 (Fig. 3G and H) cells was downregulated compared with the control cells, indicating that mitochondrial oxidation was inhibited in KMT5C-knockdown cells. In conclusion, KMT5C was found to support aerobic glycolysis and oxidative phosphorylation. In the Warburg effect, glycolysis is uncoupled from the mitochondrial tricarboxylic acid cycle, and oxidative phosphorylation remains high even with high oxygen levels in cancer cells. Therefore, knockdown of KMT5C expression may compromise the Warburg effect in ccRCC cells.
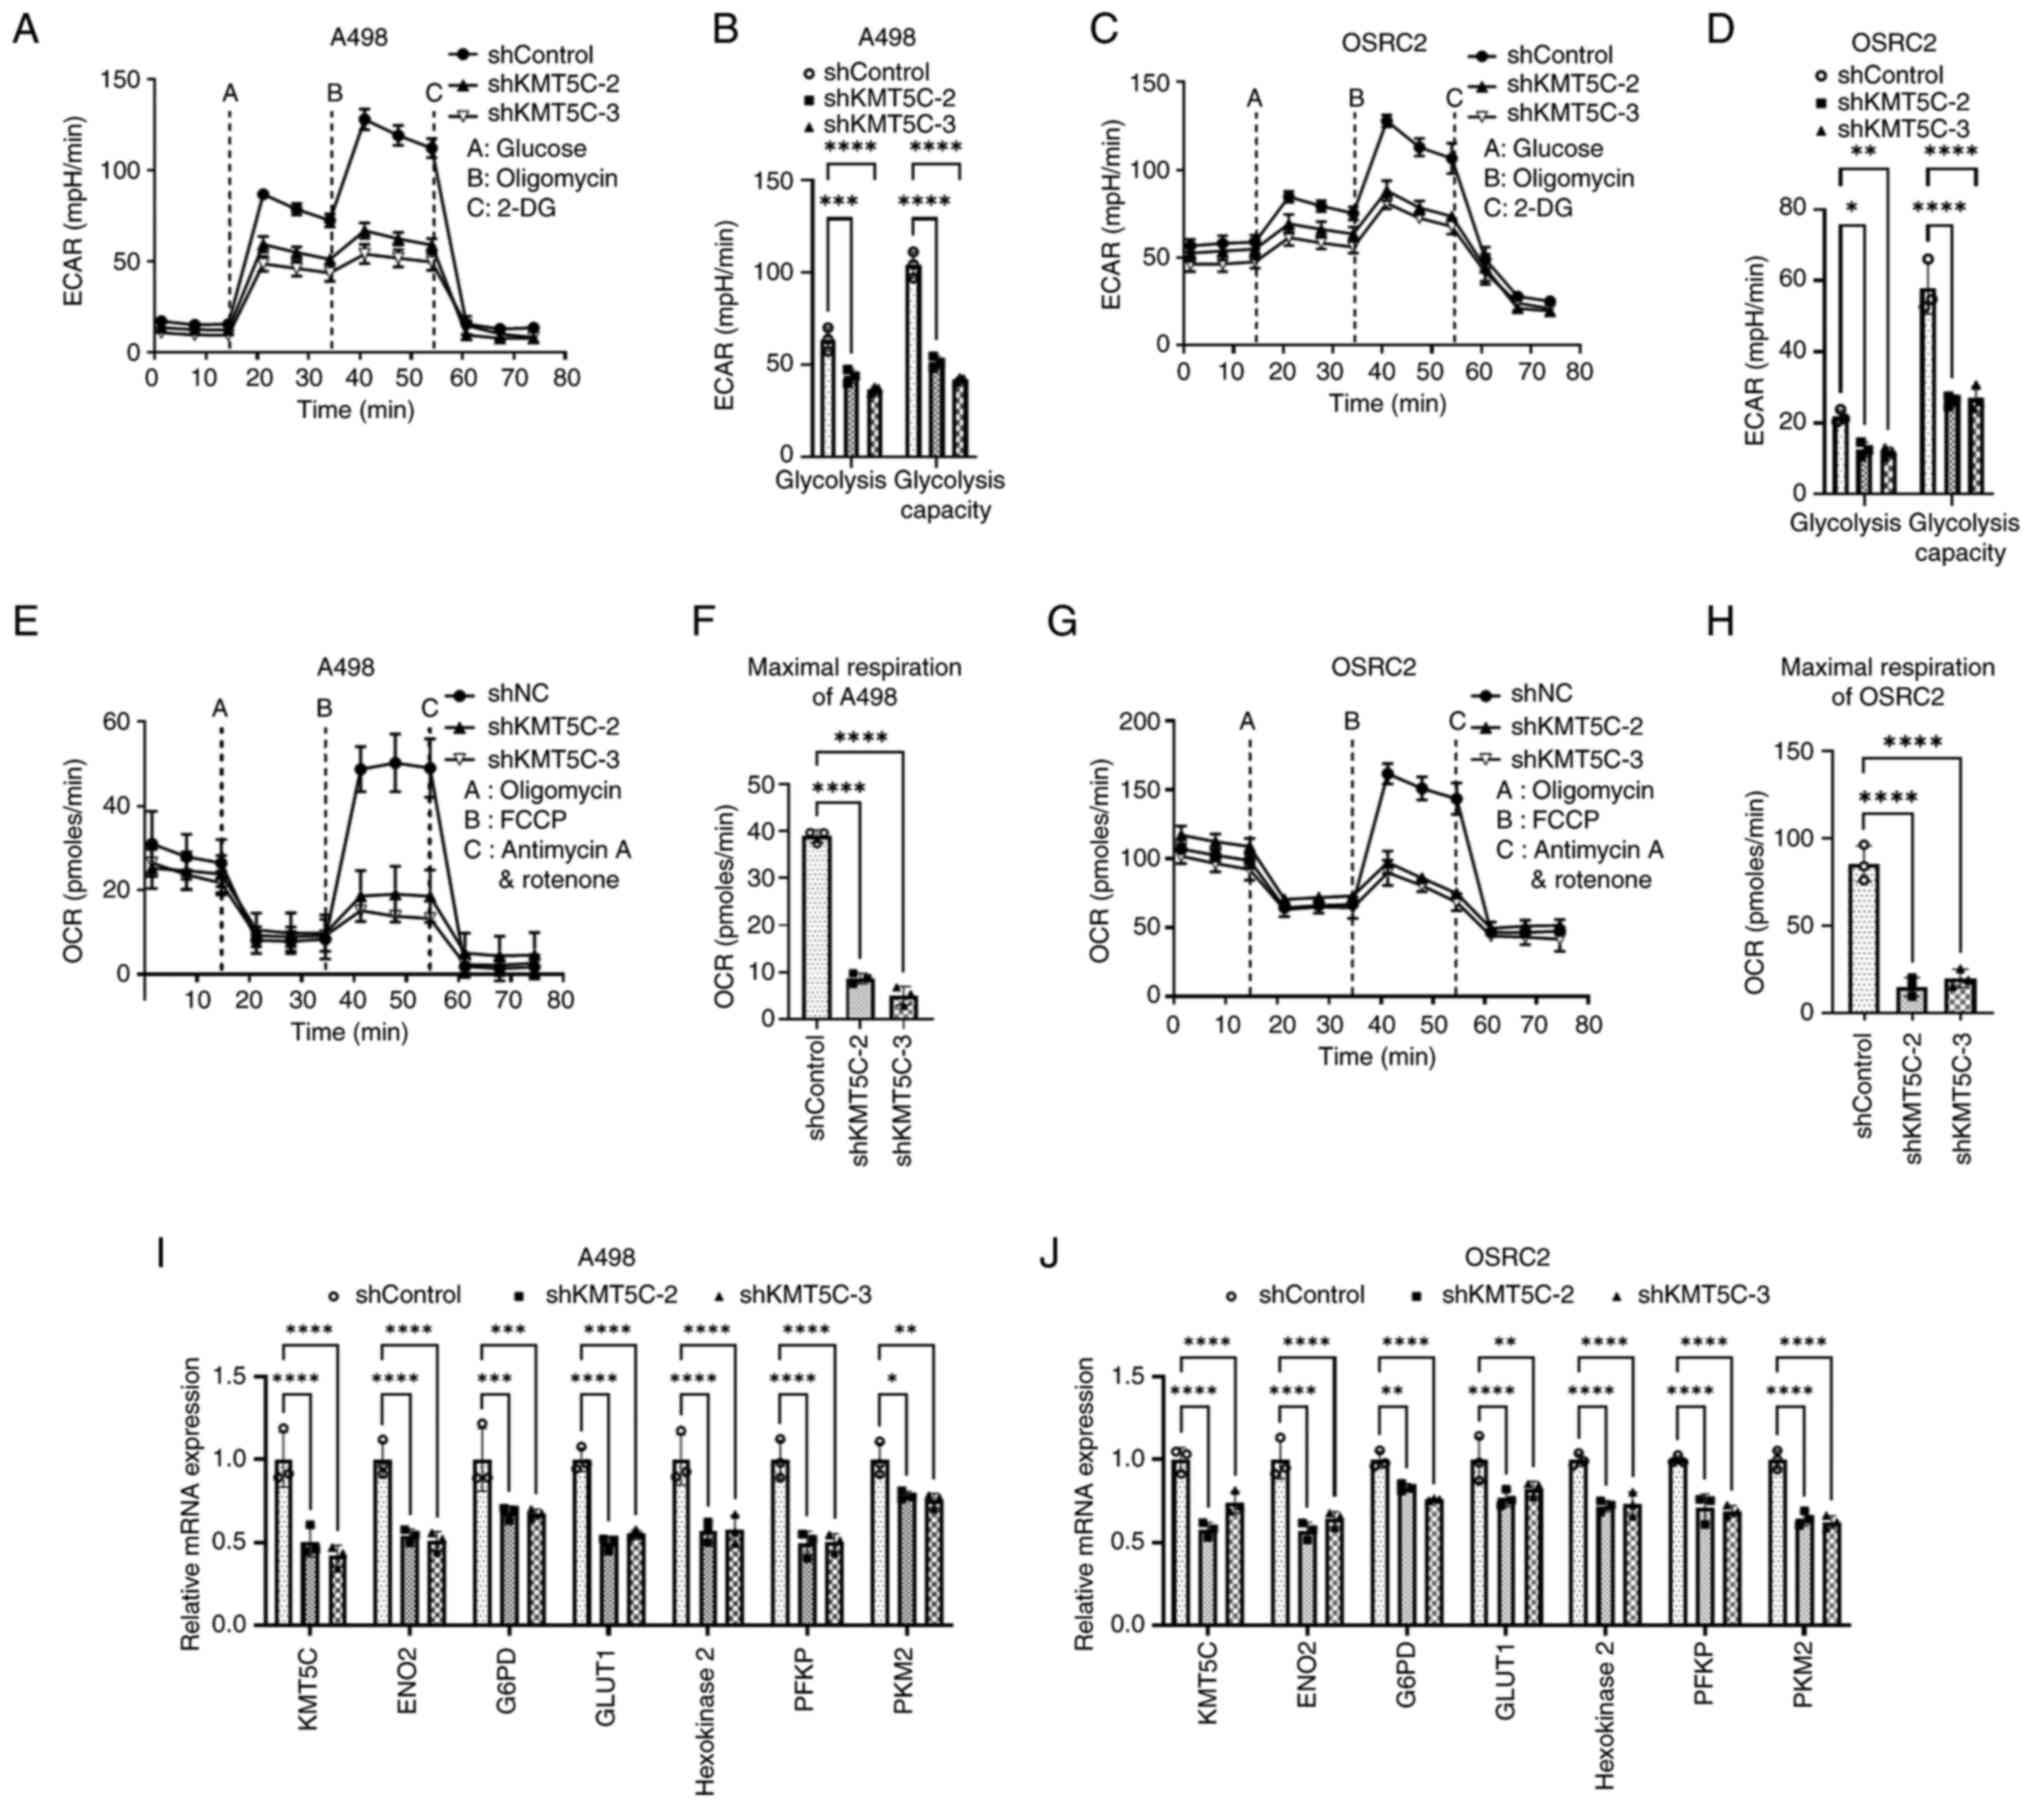
The underlying mechanisms impairing glycolysis following knockdown of KMT5C expression remained unclear. Therefore, whether the knockdown of KMT5C expression affected the expression of glycolysis-related genes was assessed in the present study. It was found that the expression levels of enolase 2, glucose-6-phosphate dehydrogenase, GLUT1, hexokinase 2, phosphofructokinase and pyruvate kinase M2 were significantly downregulated in KMT5C-knockdown A498 and OSRC2 cells compared with the corresponding control cells (Fig. 3I and J). These results demonstrated that KMT5C maintained glycolysis via regulating the transcriptional expression of certain glycolysis-associated genes.
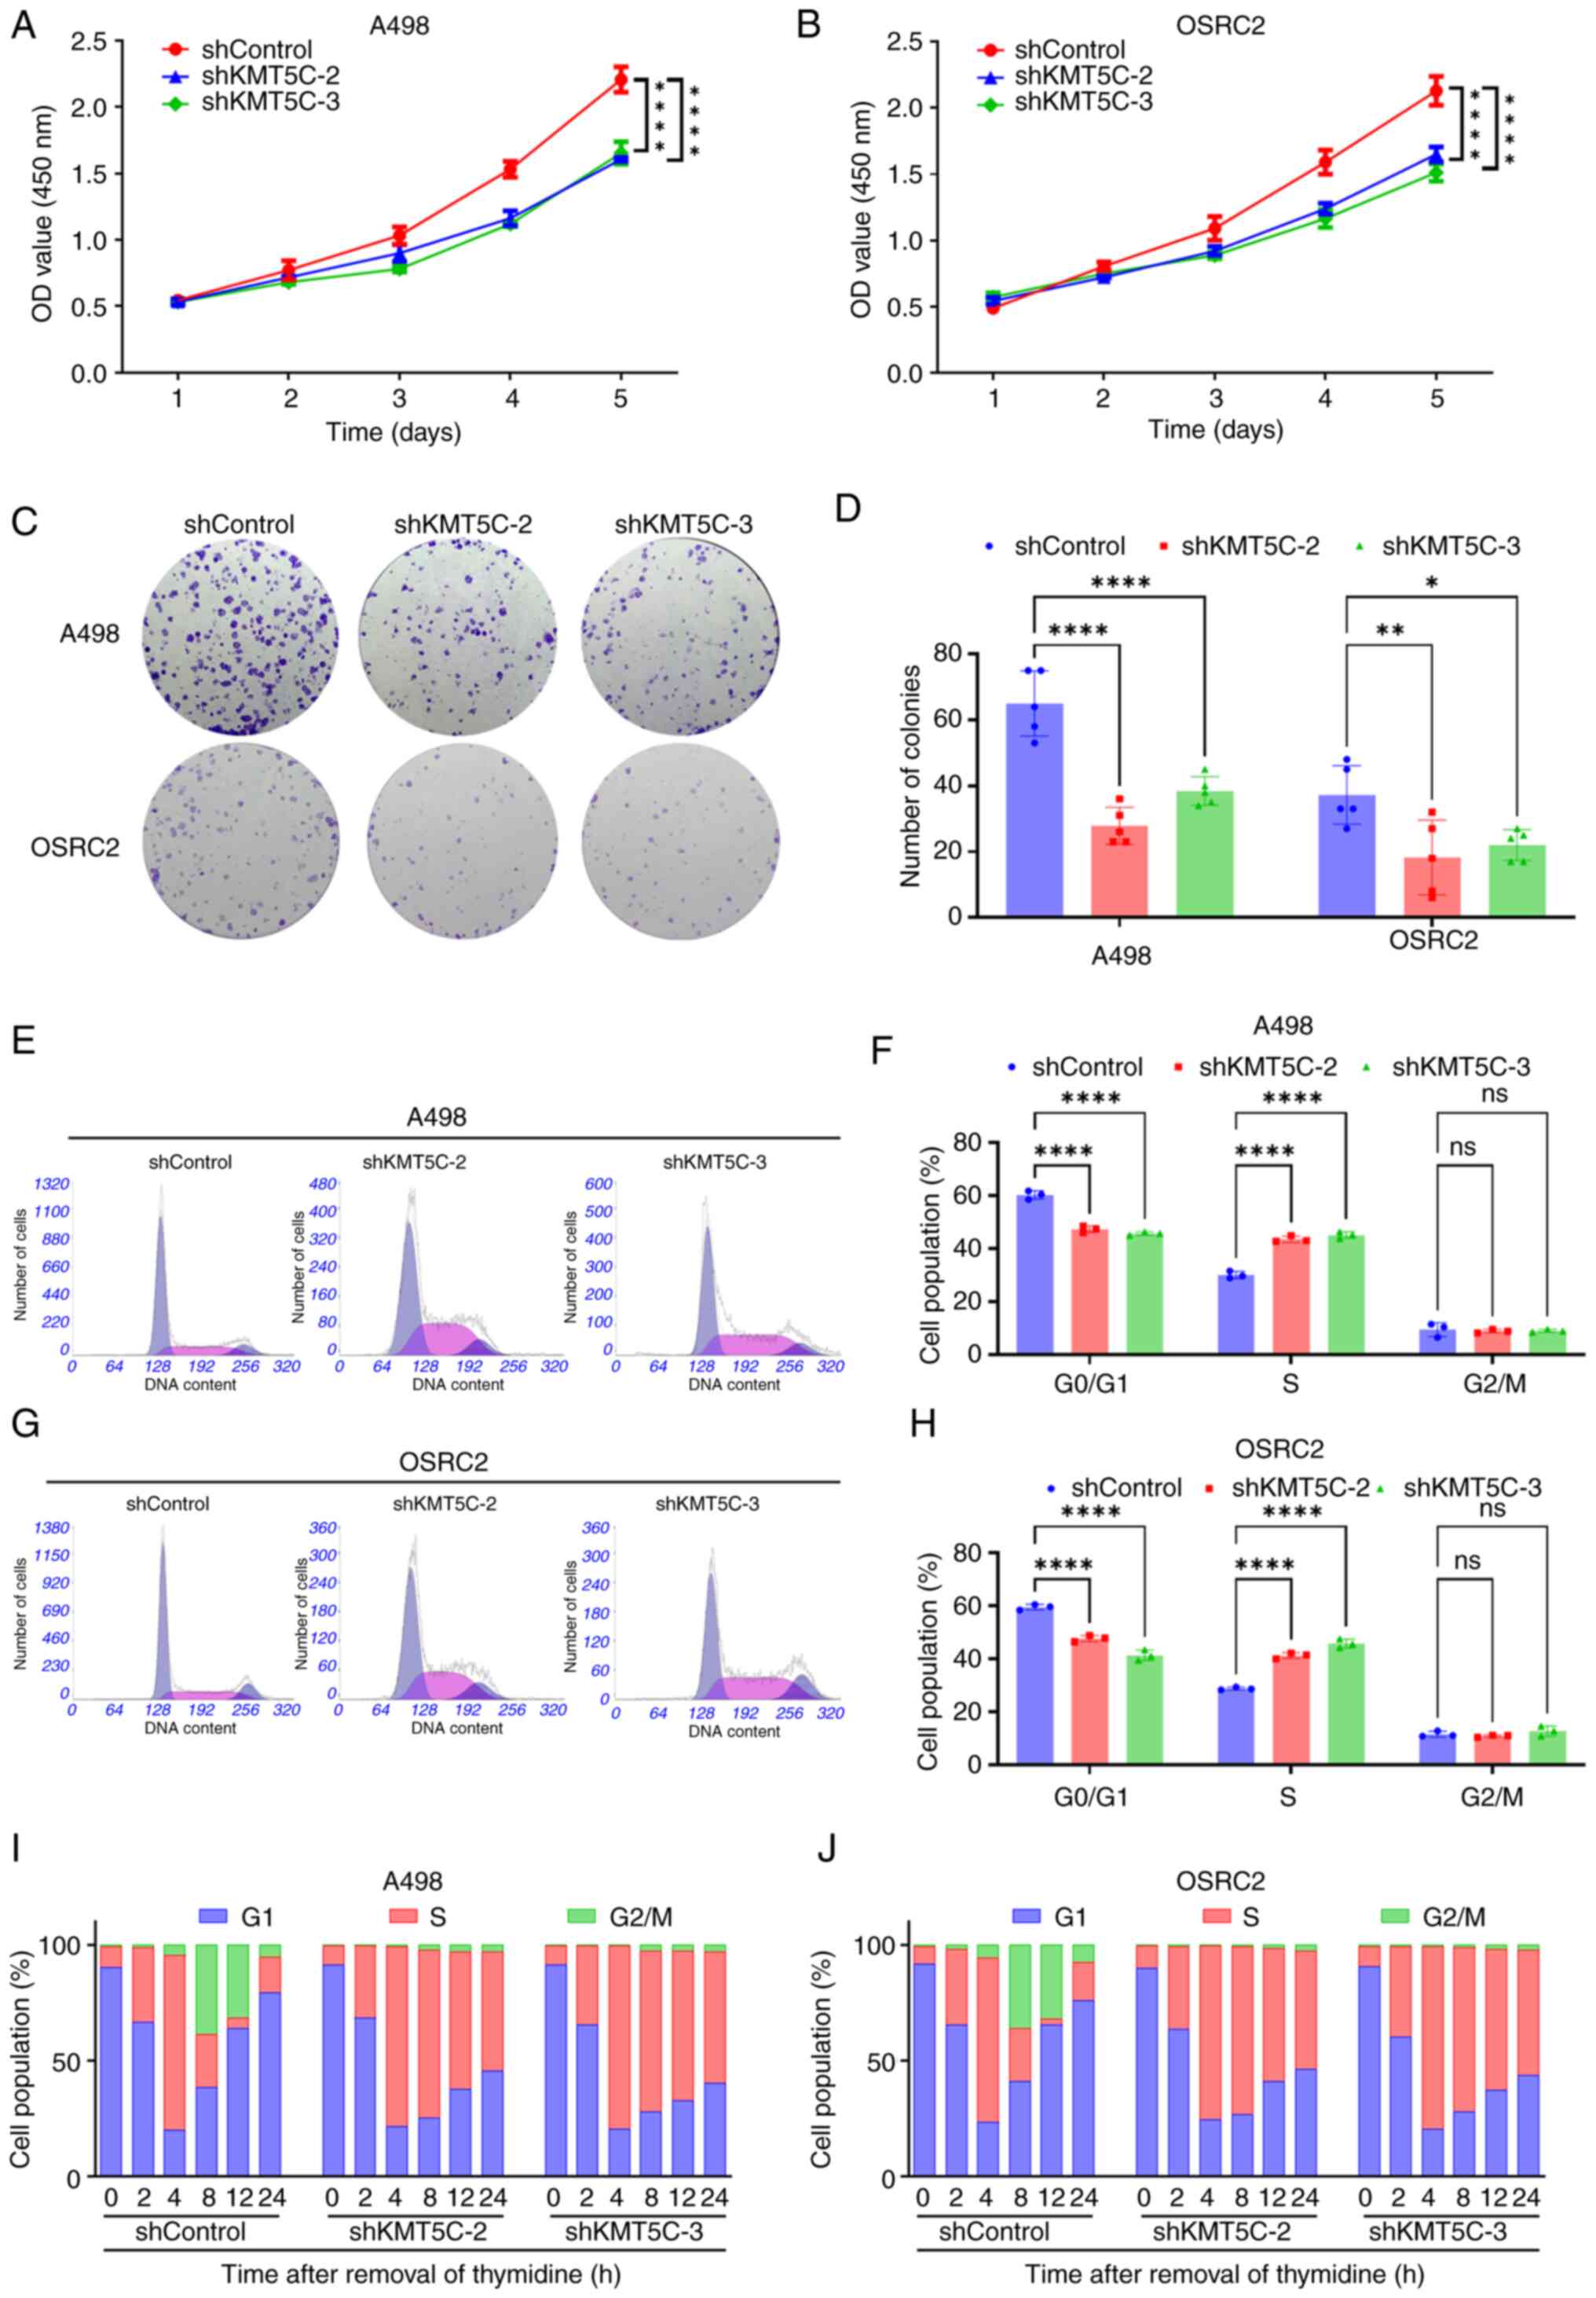
Knockdown of KMT5C expression inhibits the proliferation of ccRCC cells
The Warburg effect results in the rapid production of high levels of ATP and thus the necessary materials for biosynthesis in cancer cells. Subsequently, the absence of the Warburg effect may harm several aspects of cancer cells besides ATP production, such as biosynthesis of multiple components, redox homeostasis and DNA damage repair (32). In the present study, it was found that the proliferation of A498 and OSRC2 cells was significantly downregulated following the knockdown of KMT5C expression. In the CCK-8 assays, A498 (Fig. 4A) and OSRC2 (Fig. 4B) cells transfected with shControl plasmid had a higher level of proliferation compared with the shKMT5C cells. In the colony formation assays, fewer colonies formed with the KMT5C knockdown cells compared with the shControl cells (Fig. 4C and D). To determine the exact function of KMT5C, the effect of KMT5C expression on the cell cycle was also assessed. It was found that the population of cells in the G0/G1 phase was reduced, while the proportion of cells in the S phase increased, in the KMT5C-knockdown A498 (Fig. 4E and F) and OSRC2 (Fig. 4G and H) cells. These results indicated that ccRCC cells with downregulated KMT5C expression had a shorter G0/G1 phase and a longer S phase than the control cells, implying that downregulation of KMT5C may block the transition of the cells to the G2/M phase from the S phase, thus altering the proliferative ability of cells. Additionally, when A498 and OSRC2 cells synchronized to the G1/S phase via double thymidine blockage were released, it was found that KMT5C knockdown decreased the proportion of A498 (Figs. 4I and S1) and OSRC2 (Figs. 4J and S1) cells entering the G2/M phase. This further demonstrated that KMT5C downregulation interfered with the G2/M phase transition. In conclusion, the proliferative ability of ccRCC cells was reduced by knockdown of KMT5C expression, which was achieved via blockage of the transition of the cells to the G2/M phase.
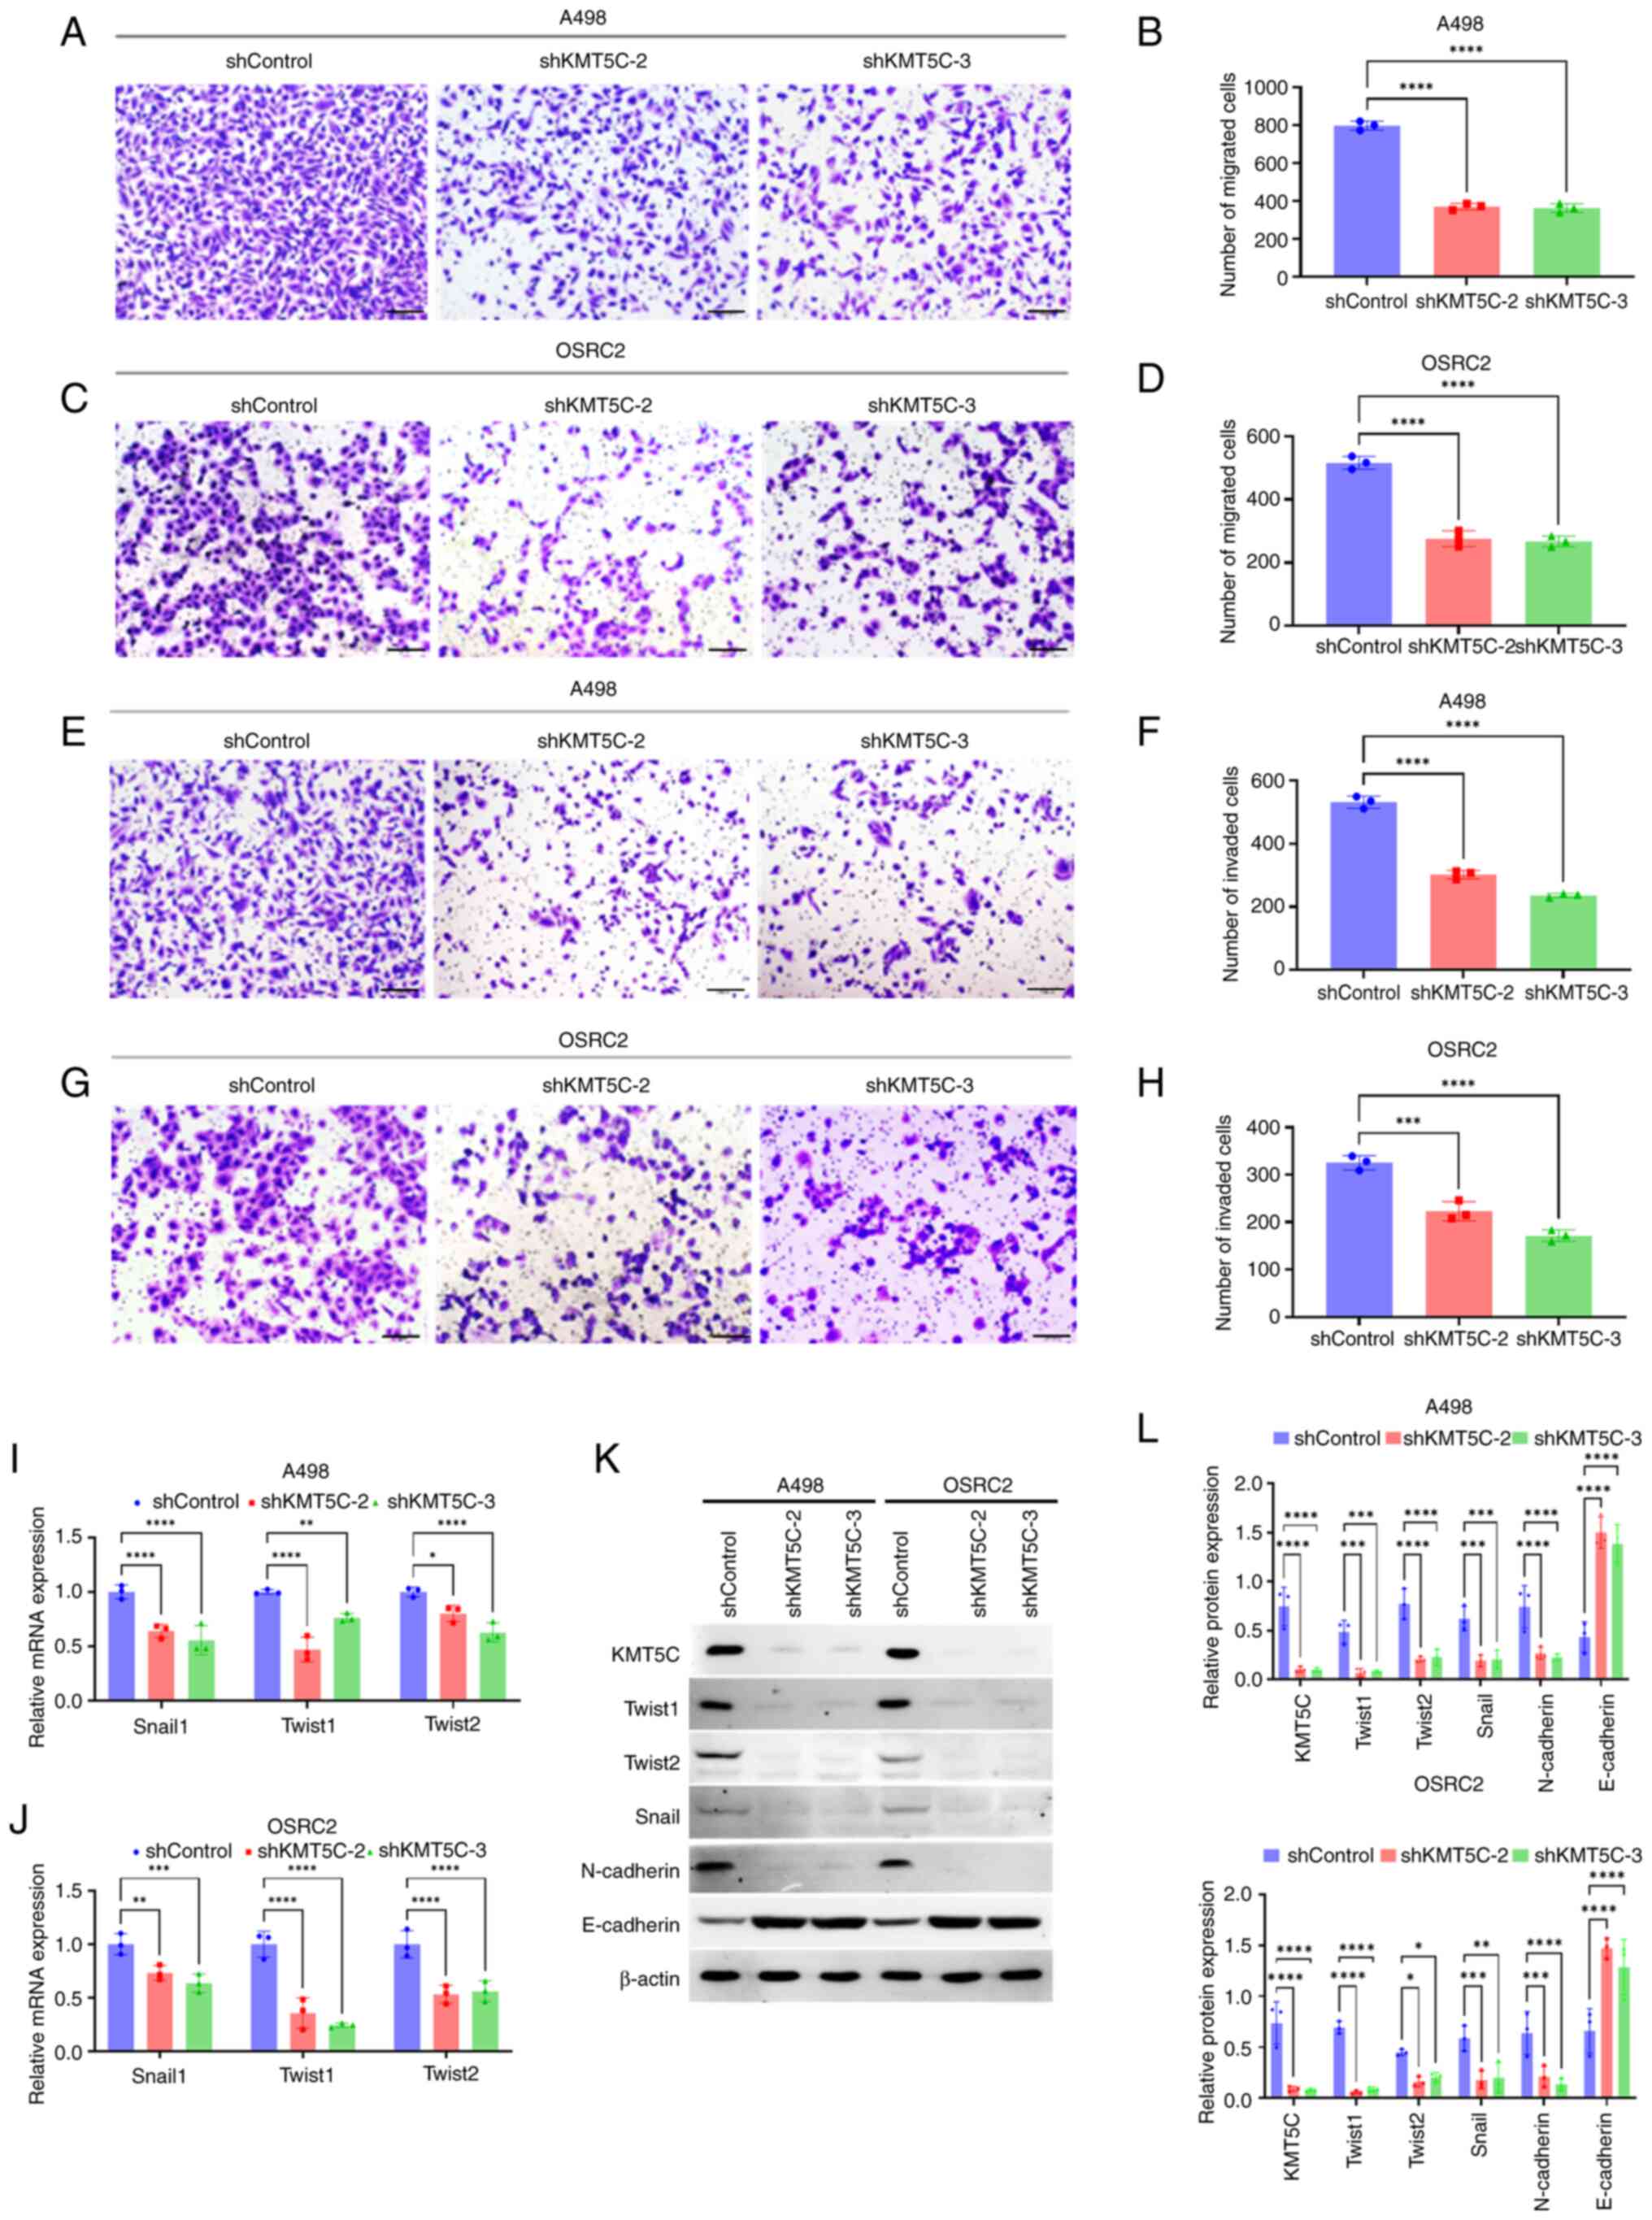
KMT5C facilitates the metastasis of ccRCC through the regulation of transcriptional factors related to EMT
The influence of KMT5C on the metastasis of ccRCC cells remains unclear as contradictory results among other cancer types have been reported, as aforementioned. In the present study, Transwell assays were used to assess the function of KMT5C on the metastasis of ccRCC cells. Knockdown of KMT5C expression in A498 (Fig. 5A and B) and OSRC2 (Fig. 5C and D) cells significantly impaired the migratory ability of the cells. Additionally, the knockdown of KMT5C inhibited the invasion capacity of A498 (Fig. 5E and F) and OSRC2 (Fig. 5G and H) cells. KMT5C has been shown to regulate EMT in pancreatic cancer and its upregulated expression was associated with a mesenchymal phenotype (25). Moreover, EMT is known to be the initial and major step in cancer metastasis (24,33). Therefore, to further explore the mechanism by which KMT5C promoted ccRCC cell metastasis, the EMT state of KMT5C-knockdown cells was assessed. The mRNA expression levels of EMT-related transcription factors such as Snail1, Twist1 and Twist2 were significantly lower in KMT5C-knockdown A498 (Fig. 5I) and OSRC2 (Fig. 5J) cells compared with the control cells. It was found that OSRC2 cells stably expressing shKMT5C-3 generally exhibited the lowest expression levels of these EMT transcription factors. Western blotting was also used to examine the protein expression levels of EMT markers in KMT5C-knockdown A498 and OSRC2 cells (Fig. 5K and L). Expression of the epithelial marker, E-cadherin, was higher in the KMT5C-knockdown cells, whereas expression of the mesenchymal marker, N-cadherin, was lower compared with the control cells. These results indicated that KMT5C regulated the expression of several transcriptional factors to modulate the EMT of ccRCC cells. Therefore, KMT5C may promote the metastasis of ccRCC cells.
Discussion
KMT5C, which catalyzes the trimethylation of H4K20, is an epigenetic regulator that was first recognized to maintain genome stability (21). Recently, the roles of H4K20me3 have been widely explored and H4K20me3 has been shown to be involved in multiple cell functions, including DNA repair, cell cycle regulation and DNA replication (34,35). However, the roles of KMT5C in cancer initiation and development have not been fully realized. Therefore, the aim of the present study was to further explore the roles of KMT5C in ccRCC.
Only a few articles have assessed the expression level of KMT5C in tumors. Gao et al (36) reported that, compared with adjacent non-tumor tissues, the expression of KMT5C mRNA was increased in hepatocellular carcinoma specimens. However, Tryndyak et al (37) found that highly metastatic breast cancer cells exhibited a decreased expression of KMT5C. In the present study, a large number of ccRCC and adjacent tissues were used for IHC and western blotting analysis. The results showed that the expression of KMT5C was significantly higher in tumor samples compared with normal samples in ccRCC. Thus, the expression level of KMT5C varies among different cancer species. More studies are required to investigate the levels and roles of KMT5C in other tumors.
KMT5C has been found to regulate lipid metabolism via downregulation of peroxisome proliferator-activated receptor-γ in KMT5C-knockout mice (30). Additionally, KMT5C and H4K20me3 were shown to be induced by hyperglycemia, which indicated its roles in glucose metabolism (38). In the present study, it was found that KMT5C was a regulator of aerobic glycolysis in ccRCC and its knockdown significantly impaired aerobic glycolysis via downregulation of certain key genes, including enolase 2, glucose-6-phosphate dehydrogenase, GLUT1, hexokinase 2, phosphofructokinase and pyruvate kinase M2. Aerobic glycolysis is elevated in cancer cells regardless of the abundance of oxygen, which is known as the Warburg effect (39). Therefore, the results of the present study indicated that the knockdown of KMT5C attenuated the Warburg effect.
The results of the present study also indicated that the proliferation of ccRCC cells was affected by KMT5C expression. Reduced proliferation was observed in the KMT5C-knockdown cells compared with the respective control cells. This effect might indicate a relationship between KMT5C and RB transcriptional corepressor 1, a negative regulator of the cell cycle (40); however, further experiments are required to fully explore the underlying mechanism. The results of the present study contradicted those observed in breast cancer. In breast cancer, KMT5C has largely been considered a tumor suppressor gene given its roles in suppressing cancer invasion and migration. Expression of KMT5C reduces EMT, migration and invasion of breast cancer cells via EGR1, connective tissue growth factor and tensin-3. Knockdown of KMT5C significantly decreases trimethylation of H4K20 in the promotor regions of these genes and reduces their repression (22,23). In pancreatic cancer, the expression of KMT5C in cells was shown to favor a mesenchymal state. Furthermore, knockdown of KMT5C resulted in an upregulation of epithelial markers and reduced the migration and invasion abilities of cells. Additionally, upregulation of KMT5C was associated with EMT transcription factors such as forkhead box A1, Ovo-like transcription repressor (OVOL)1, and OVOL2, and KMT5C upregulation induced EMT in epithelial pancreatic cancer cells (25). In the present study, it was found that knockdown of KMT5C expression repressed EMT and reduced the migratory and invasive capacity of ccRCC cells.
The results of the present study demonstrated that KMT5C facilitated the migration of ccRCC cells via the regulation of EMT-related genes. Expression alterations in the EMT-related genes in KMT5C-knockdown ccRCC cells were similar to those observed in pancreatic cancer (24), in which an increase in E-cadherin expression and a decrease in N-cadherin expression at the protein level was observed. Additionally, downregulation of Twist1, Twist2 and Snail were observed following the knockdown of KMT5C (24). Taken together, KMT5C promoted EMT and increased the metastatic capacity of ccRCC cells. However, there are several limitations in the present study. In determining the prognostic value of KMT5C, the size of the validation cohort was relatively small compared with the TCGA cohort. In addition, the functions of KMT5C were examined in vitro but not in vivo. Furthermore, the relationship between KMT5C and the immune system was not explored in the present study.
In conclusion, in the present study, it was found that KMT5C may act as an oncoprotein, which may therefore guide molecular diagnosis in the future and shed light on novel drug development and therapeutic strategies for patients with ccRCC.
Supplementary Data
Availability of data and materials
The data generated in the present study may be requested from the corresponding author.
Authors' contributions
DY and FX conceived and designed the study. BZ, RW, KC, JL, XZ and GS collected clinical information and tissues of the patients with ccRCC. BZ, RW and KC performed the experiments. BZ, RW and FX wrote the original draft of the manuscript. KC, DY and FX reviewed and edited the manuscript. DY, FX, BZ, RW, KC, JL, XZ and GS confirm the authenticity of all the raw data. All authors have read and approved the final version of the manuscript.
Ethics approval and consent to participate
The present study was performed in accordance with the guidelines described in the Declaration of Helsinki and was approved by The Institutional Review Board of Fudan University Shanghai Cancer Center (Shanghai, China; approval no. 2304-ZZK-89) Written informed consent was obtained from each patient.
Patient consent for publication
Not applicable.
Competing interests
The authors declare that they have no competing interests.
Acknowledgments
Not applicable.
Funding
This study was funded by the China Postdoctoral Science Foundation (grant no. 2023M742905), the Luzhou Science and Technology Program (grant nos. 2023JYJ008 and 2022-SYF-63) and the Doctoral Research Initiation Fund of Affiliated Hospital of Southwest Medical University (grant nos. 22043 and 22167).
References
|
Sung H, Ferlay J, Siegel RL, Laversanne M, Soerjomataram I, Jemal A and Bray F: Global cancer statistics 2020: GLOBOCAN estimates of incidence and mortality worldwide for 36 cancers in 185 countries. CA Cancer J Clin. 71:209–249. 2021. View Article : Google Scholar : PubMed/NCBI | |
|
Ward EM, Sherman RL, Henley SJ, Jemal A, Siegel DA, Feuer EJ, Firth AU, Kohler BA, Scott S, Ma J, et al: Annual report to the nation on the status of cancer, featuring cancer in men and women age 20-49 years. J Natl Cancer Inst. 111:1279–1297. 2019. View Article : Google Scholar : PubMed/NCBI | |
|
Siegel RL, Miller KD, Fuchs HE and Jemal A: Cancer statistics, 2022. CA Cancer J Clin. 72:7–33. 2022. View Article : Google Scholar : PubMed/NCBI | |
|
Znaor A, Lortet-Tieulent J, Laversanne M, Jemal A and Bray F: International variations and trends in renal cell carcinoma incidence and mortality. Eur Urol. 67:519–530. 2015. View Article : Google Scholar | |
|
Moch H, Cubilla AL, Humphrey PA, Reuter VE and Ulbright TM: The 2016 WHO classification of tumours of the urinary system and male genital organs-part A: Renal, penile, and testicular tumours. Eur Urol. 70:93–105. 2016. View Article : Google Scholar : PubMed/NCBI | |
|
Jonasch E, Gao J and Rathmell WK: Renal cell carcinoma. BMJ. 349:g47972014. View Article : Google Scholar : PubMed/NCBI | |
|
Bannister AJ and Kouzarides T: Regulation of chromatin by histone modifications. Cell Res. 21:381–395. 2011. View Article : Google Scholar : PubMed/NCBI | |
|
Lawrence M, Daujat S and Schneider R: Lateral thinking: How histone modifications regulate gene expression. Trends Genet. 32:42–56. 2016. View Article : Google Scholar | |
|
Audia JE and Campbell RM: Histone modifications and cancer. Cold Spring Harb Perspect Biol. 8:a0195212016. View Article : Google Scholar : PubMed/NCBI | |
|
Morgan MA and Shilatifard A: Chromatin signatures of cancer. Genes Dev. 29:238–249. 2015. View Article : Google Scholar : PubMed/NCBI | |
|
Cancer Genome Atlas Research Network: Comprehensive molecular characterization of clear cell renal cell carcinoma. Nature. 499:43–49. 2013. View Article : Google Scholar : PubMed/NCBI | |
|
Dawson MA and Kouzarides T: Cancer epigenetics: From mechanism to therapy. Cell. 150:12–27. 2012. View Article : Google Scholar : PubMed/NCBI | |
|
Herz HM, Garruss A and Shilatifard A: SET for life: Biochemical activities and biological functions of SET domain-containing proteins. Trends Biochem Sci. 38:621–639. 2013. View Article : Google Scholar | |
|
Wang Y and Jia S: Degrees make all the difference: The multifunctionality of histone H4 lysine 20 methylation. Epigenetics. 4:273–276. 2009. View Article : Google Scholar : PubMed/NCBI | |
|
van Nuland R and Gozani O: Histone H4 lysine 20 (H4K20) methylation, expanding the signaling potential of the proteome one methyl moiety at a time. Mol Cell Proteomics. 15:755–764. 2016. View Article : Google Scholar : | |
|
Svobodová Kovaříková A, Legartová S, Krejčí J and Bártová E: H3K9me3 and H4K20me3 represent the epigenetic landscape for 53BP1 binding to DNA lesions. Aging (Albany NY). 10:2585–2605. 2018. View Article : Google Scholar | |
|
Tsang LW, Hu N and Underhill DA: Comparative analyses of SUV420H1 isoforms and SUV420H2 reveal differences in their cellular localization and effects on myogenic differentiation. PLoS One. 5:e144472010. View Article : Google Scholar | |
|
Bromberg KD, Mitchell TR, Upadhyay AK, Jakob CG, Jhala MA, Comess KM, Lasko LM, Li C, Tuzon CT, Dai Y, et al: The SUV4-20 inhibitor A-196 verifies a role for epigenetics in genomic integrity. Nat Chem Biol. 13:317–324. 2017. View Article : Google Scholar : PubMed/NCBI | |
|
Carvalho Alves-Silva J, do Amaral Rabello D, Oliveira Bravo M, Lucena-Araujo A, Madureira de Oliveira D, Morato de Oliveira F, Magalhaes Rego E, Pittella-Silva F and Saldanha-Araujo F: Aberrant levels of SUV39H1 and SUV39H2 methyltransferase are associated with genomic instability in chronic lymphocytic leukemia. Environ Mol Mutagen. 58:654–661. 2017. View Article : Google Scholar : PubMed/NCBI | |
|
Khani F, Thaler R, Paradise CR, Deyle DR, Kruijthof-de Julio M, Galindo M, Gordon JA, Stein GS, Dudakovic A and van Wijnen AJ: Histone H4 methyltransferase Suv420h2 maintains fidelity of osteoblast differentiation. J Cell Biochem. 118:1262–1272. 2017. View Article : Google Scholar | |
|
Jørgensen S, Schotta G and Sørensen CS: Histone H4 lysine 20 methylation: Key player in epigenetic regulation of genomic integrity. Nucleic Acids Res. 41:2797–2806. 2013. View Article : Google Scholar : PubMed/NCBI | |
|
Shinchi Y, Hieda M, Nishioka Y, Matsumoto A, Yokoyama Y, Kimura H, Matsuura S and Matsuura N: SUV420H2 suppresses breast cancer cell invasion through down regulation of the SH2 domain-containing focal adhesion protein tensin-3. Exp Cell Res. 334:90–99. 2015. View Article : Google Scholar : PubMed/NCBI | |
|
Wu Y, Shi W, Tang T, Wang Y, Yin X, Chen Y, Zhang Y, Xing Y, Shen Y, Xia T, et al: miR-29a contributes to breast cancer cells epithelial-mesenchymal transition, migration, and invasion via down-regulating histone H4K20 trimethylation through directly targeting SUV420H2. Cell Death Dis. 10:1762019. View Article : Google Scholar : PubMed/NCBI | |
|
Pastushenko I and Blanpain C: EMT transition states during tumor progression and metastasis. Trends Cell Biol. 29:212–226. 2019. View Article : Google Scholar | |
|
Viotti M, Wilson C, McCleland M, Koeppen H, Haley B, Jhunjhunwala S, Klijn C, Modrusan Z, Arnott D, Classon M, et al: SUV420H2 is an epigenetic regulator of epithelial/mesenchymal states in pancreatic cancer. J Cell Biol. 217:763–777. 2018. View Article : Google Scholar : | |
|
Goldman MJ, Craft B, Hastie M, Repečka K, McDade F, Kamath A, Banerjee A, Luo Y, Rogers D, Brooks AN, et al: Visualizing and interpreting cancer genomics data via the Xena platform. Nat Biotechnol. 38:675–678. 2020. View Article : Google Scholar : PubMed/NCBI | |
|
Livak KJ and Schmittgen TD: Analysis of relative gene expression data using real-time quantitative PCR and the 2(-Delta Delta C(T)) method. Methods. 25:402–408. 2001. View Article : Google Scholar | |
|
Yiangou L, Grandy RA, Morell CM, Tomaz RA, Osnato A, Kadiwala J, Muraro D, Garcia-Bernardo J, Nakanoh S, Bernard WG, et al: Method to synchronize cell cycle of human pluripotent stem cells without affecting their fundamental characteristics. Stem Cell Reports. 12:165–179. 2019. View Article : Google Scholar : PubMed/NCBI | |
|
Caines JK, Barnes DA and Berry MD: The Use of seahorse XF assays to interrogate real-time energy metabolism in cancer cell lines. Methods Mol Biol. 2508:225–234. 2022. View Article : Google Scholar : PubMed/NCBI | |
|
Zhao Q, Zhang Z, Rong W, Jin W, Yan L, Jin W, Xu Y, Cui X, Tang QQ and Pan D: KMT5c modulates adipocyte thermogenesis by regulating Trp53 expression. Proc Natl Acad Sci USA. 117:22413–22422. 2020. View Article : Google Scholar : PubMed/NCBI | |
|
Son MJ, Kim WK, Oh KJ, Park A, Lee da S, Han BS, Lee SC and Bae KH: Methyltransferase and demethylase profiling studies during brown adipocyte differentiation. BMB Rep. 49:388–393. 2016. View Article : Google Scholar : PubMed/NCBI | |
|
Kang H, Kim B, Park J, Youn H and Youn B: The warburg effect on radioresistance: Survival beyond growth. Biochim Biophys Acta Rev Cancer. 1878:1889882023. View Article : Google Scholar : PubMed/NCBI | |
|
Jehanno C, Vulin M, Richina V, Richina F and Bentires-Alj M: Phenotypic plasticity during metastatic colonization. Trends Cell Biol. 32:854–867. 2022. View Article : Google Scholar : PubMed/NCBI | |
|
Kurup JT, Han Z, Jin W and Kidder BL: H4K20me3 methyltransferase SUV420H2 shapes the chromatin landscape of pluripotent embryonic stem cells. Development. 147:dev1885162020. View Article : Google Scholar : PubMed/NCBI | |
|
Gabellini D and Pedrotti S: The SUV4-20H histone methyltransferases in health and disease. Int J Mol Sci. 23:47362022. View Article : Google Scholar : PubMed/NCBI | |
|
Gao J, Li E, Liu W, Yang Q, Xie C, Ai J, Zhou F, Liao W and Wu L: Circular RNA MYLK promotes hepatocellular carcinoma progression through the miR29a/KMT5C signaling pathway. Onco Targets Ther. 13:8615–8627. 2020. View Article : Google Scholar : PubMed/NCBI | |
|
Tryndyak VP, Kovalchuk O and Pogribny IP: Loss of DNA methylation and histone H4 lysine 20 trimethylation in human breast cancer cells is associated with aberrant expression of DNA methyltransferase 1, SUV420H2 histone methyltransferase and methyl-binding proteins. Cancer Biol Ther. 5:65–70. 2006. View Article : Google Scholar | |
|
Pedrotti S, Caccia R, Neguembor MV, Garcia-Manteiga JM, Ferri G, de Palma C, Canu T, Giovarelli M, Marra P, Fiocchi A, et al: The Suv420h histone methyltransferases regulate PPAR-gamma and energy expenditure in response to environmental stimuli. Sci Adv. 5:eaav14722019. View Article : Google Scholar | |
|
Wang Y and Patti GJ: The warburg effect: A signature of mitochondrial overload. Trends Cell Biol. 33:1014–1020. 2023. View Article : Google Scholar : PubMed/NCBI | |
|
Cho HS, Suzuki T, Dohmae N, Hayami S, Unoki M, Yoshimatsu M, Toyokawa G, Takawa M, Chen T, Kurash JK, et al: Demethylation of RB regulator MYPT1 by histone demethylase LSD1 promotes cell cycle progression in cancer cells. Cancer Res. 71:655–660. 2011. View Article : Google Scholar |